Here is an article by Eric Boehm at reason.com.
EB is on target. Far from solving problems, Government's "solutions" too often represent collusion with providers that creates problems. Of course, the reasons given for these "solutions" always sound good - to those without the background to see the fallacies behind them.
------------------------------------------
A state commission, acting at the behest of Michigan's largest hospital chain, voted on Thursday to restrict cancer patients' access to promising, potentially lifesaving treatments.
It's another example of the problems caused by little-known state-level health care regulations known as Certificate of Necessity (or, in some states, Certificate of Public Need) laws. These laws are supposed to slow down increasing costs, but they often end up being used to restrict competition, often at the request of powerful hospital chains.
That's exactly what seems to have happened in Michigan, where the state's Certificate of Need Commission voted Thursday to impose new accreditation requirements for health care providers who want to offer new immunotherapy cancer treatments. Those treatments attempt to program the body's own immune system to attack and kill cancer cells, and they have become an increasingly attractive way to combat cancer alongside more traditional methods, such as surgery, chemotherapy, and radiation.
One particularly promising type of immunotherapy involves literally bio-engineering T-cells—the foot-soldiers of the body's immune system—and equipping them with new Chimeric Antigen Receptors that target cancer cells. This so-called "CAR T-cell therapy" is every bit as badass as it sounds.
But under the new rules adopted by the Michigan Certificate of Need Commission, hospitals will need to go through unnecessary third-party accreditation processes before being able to offer CAR T-cell therapies. Even after obtaining that additional accreditation, hospitals would have to come back to the CON commission for another approval—a process that effectively means only large, wealthy, hospital-based cancer centers will be able to offer the treatments.
The new rules were "opposed by cancer research organizations, patient advocates and pharmaceutical companies, who argue it would add an unnecessary level of regulation and deny many patients access to potentially life-saving treatment," reports Michigan Capital Confidential, a nonprofit journalism outfit covering Michigan politics.
In favor of the new rules? The University of Michigan Health System, the state's largest hospital system, which argues that the new rules are necessary for patient safety.
To be clear: It's not a question of patient safety. In 2017, the Food and Drug Administration (FDA) approved two CAR T-cell therapies for children suffering from leukemia and for adults with advanced lymphoma. Although the technology is still being developed and other uses of T-cell therapies are yet to be approved by the FDA, the Michigan CON Commission does not do medical testing. Like similar agencies in other states, the extent of its mandate is purely economic, not medical.
Anna Parsons, a policy coordinator with the American Legislative Exchange Council, points out that the safe administration of CAR T-cell therapy does not require hospitals to make new capital investments—which is the only time CON laws should apply. Literally any FDA-certified hospital should be capable of offering these treatments, since all the high-tech bioengineering is done at other locations. The only thing that happens at the hospital is a simple blood transfusion.
Though the specific applications of CON laws differ from state to state, their stated purpose is to prevent overinvestment and keep hospitals from having to charge higher prices to make up for unnecessary outlays of capital costs. But in practice, they mean hospitals must get a state agency's permission before offering new services or installing new medical technology. Depending on the state, everything from the number of hospital beds to the installation of a new MRI machine could be subject to CON review.
As part of that review process, it's not uncommon for large hospital chains to wield CON laws in order to limit competition, even at the expense of patient outcomes.
From 2010 to 2013, for example, the state agency in charge of Virginia's CON laws repeatedly blocked attempts by a small hospital in Salem, Virginia, to build a neonatal intensive care unit (NICU), in large part because a nearby hospital—which happened to have the only NICU in southwestern Virginia—objected to the new competition. Even after a premature infant died at the Salem hospital, state regulators continued to side with the Salem hospital's chief competitor, against the wishes of doctors, hospital administrators, public officials, and patients who repeatedly testified in favor of letting the new NICU be built.
Even when the outcomes aren't as tragic as dead babies or untreated cancer patients, CON laws have adverse consequences. In 2016, reseachers at the Mercatus Center at George Mason University found that hospitals in states with CON laws have higher mortality rates than hospitals in non-CON states. The average 30-day mortality rate for patients with pneumonia, heart failure, and heart attacks in states with CON laws is between 2.5 percent and 5 percent higher even after demographic factors are taken out of the equation.
When it comes to CAR T-cell therapy, there does not seem to be any compelling reason for Michigan regulators to use CON laws except to explicitly limit which hospitals can provide those treatments.
"We will never know how many more lives this therapy could have saved if the added time and expense these onerous regulations put in place discourage hospitals and clinics from providing treatment in the first place," Parsons wrote this week in The Detroit News.
Under Michigan law, the legislature has 45 days to review and overturn the decisions of the CON Commission. Here is one situation where that is exactly what it should do.
Friday, September 20, 2019
Monday, September 16, 2019
Climate change: Carbon Dioxide or Solar Forcing
Here is an article by Nir Shaviv, a top expert in the field.
Yes Virginia, the Climate Alarmists are wrong again.
----------------------------------------------------
Natural or Anthropogenic? Which mechanism is responsible for global warming over the 20th century?
According to the common perception, the temperature over the 20th century has been warming, and it is mostly anthropogenic in origin, with greenhouse gases (GHGs) being the dominant driver. Others, usually called "skeptics", challenge this view and instead claim that the temperature variations are all part of natural variability. As I try to demonstrate below, the truth is probably somewhere in between, with natural causes probably being more important over the past century, whereas anthropogenic causes will probably be more dominant over the next century. Following empirical evidence I describe below, about 2/3's (give or take a third or so) of the warming should be attributed to increased solar activity and the remaining to anthropogenic causes.
Like many others, I was personally sure that CO2 is the bad culprit in the story of global warming. But after carefully digging into the evidence, I realized that things are far more complicated than the story sold to us by many climate scientists or the stories regurgitated by the media. In fact, there is much more than meets the eye.
WHAT IS THE EVIDENCE FOR AN ANTHROPOGENIC EFFECT?
Hence, using models to find fingerprints is hard. If you read the TAR (in particular, chapter 12), you will find claims that the different warming in northern vs. southern latitudes, and tropospheric vs. stratospheric warming can be explained using anthropogenic GHGs operating together with sulphate aerosols, stratospheric ozone and even solar (total irradiance) forcing. Namely, the combination of the drivers can do a descent job in explaining the warming (IPCC TAR §12.4.3.2):
“In summary, the fixed pattern studies indicate that the recent warming is unlikely (bordering on very unlikely) to be due to internal climate variability. A substantial response to anthropogenic greenhouse gases appears to be necessary to account for recent temperature trends but the majority of studies indicate that greenhouse gases alone do not appear to be able to provide a full explanation. Inclusion of the response to the direct effect of sulphate aerosols usually leads to a more satisfactory explanation of the observed changes, although the amplitude of the sulphate signal depends on the model used. These studies also provide some evidence that solar variations may have contributed to the early century warming.”
But in itself it is not proof that GHGs are the major cause. These consistent results only indicate that CO2 can explain the warming, not that it is the only possible explanation. Without other "suspects", it would be incriminating circumstantial evidence. However another very good candidate to explain a large fraction of the warming does exist, as I explain below.

Fig. 1: Correlation between atmospheric CO2 and climate. Nope, it is not proof that CO2 is a major climate driver, since CO2 can be driven by temperature changes. Specifically, warmer oceans requires larger atmospheric partial pressures of CO2 to contain the dissolved gas in them. Of course, some of the temperature could be the result of CO2 amplifications, but there is no way of knowing what fraction.
Of course, the beautiful correlation between CO2 reconstructions and temperature on Earth over the multi-millennial time scale, as it apparent in the figure, is often used to demonstrate how CO2 plays a role in large climate variations. This often misleads the laymen to believe that CO2 is the climate driver, whereas in fact it could be the opposite, that the global temperature affects the equilibrium levels of CO2. In reality it could be somewhere in between, that CO2 is affected by the temperature and that it in turn causes a larger temperature variation. Just by itself, however, this correlation cannot be used to quantify the effect of CO2 on the climate, which could be anywhere from no effect to all the effect. Thus, it is no proof that CO2 is the main cause of the variations over the 20th century. There is no such evidence.
As far as I see it, there are two main reasons why GHGs are blamed as the main cause of global warming even through there is no real incriminating evidence:
As to the second point, there is another good mechanism to blame, that of indirect solar forcing. This mechanism can do just as good a job in explaining 20th century warming as CO2, if not a better one.
THE ANTHROPOGENIC DRIVING - HOW MUCH IS IT?

Fig. 2: Anthropogenic and Natural contributions to the net radiative forcing. Figure from the IPCC TAR. If one adds their numbers (which are supposed to capture the community's consensus, one finds an Anthropogenic forcing of: 0.8 ± 1.3 W/m² (where the errors were added in quadrature, assuming independence). In other words, the large uncertainty in the indirect aerosol effects, implies that the sign of the Anthropogenic contribution is unknown!
Evidently, we do not know the total Anthropogenic forcing. We don't know its sign. We also don't know its magnitude. All we can say is that it should be somewhere between -1 to +2 W/m². Sounds strange, but we may have actually been cooling Earth (though less likely than warming). It is for this reason that in the 1970's, concerns were raised that humanity is cooling the global temperature. The global temperature appeared to drop between the 1940's and 1970's, and some thought that anthropogenic aerosols could be the cause of the observed global cooling, and that we may be triggering a new ice-age (e.g., see wikiepdia for a summary)
CLIMATE SENSITIVITY
SO, CAN CO2 BE INCRIMINATED?
Clearly, the incrimination of CO2 (and other GHGs) is primarily because we expect it to warm (see fig. 4), and we do see warming (see fig. 3), but it turns out that there are other suspects.


Fig. 4: Carbon Dioxide in the atmosphere. Just like the global temperature, it increased over the 20th century. Since theoretically we expect the gas to warm, it is often incriminated as the main culprit behind global warming. But there is no direct evidence proving that it is it which is the primary warmer and not another mechanism. (image source: Wikipedia)
AN ALTERNATIVE EXPLANATION FOR GLOBAL WARMING, OR AT LEAST PART OF IT
The activity of the sun manifests its self in many ways. One of them is through a variable solar wind. This flux of energetic particles and entangled magnetic field flows outwards from the sun, and impedes on a flux of more energetic particles, the cosmic rays, which come from outside the solar system. Namely, a more active sun with a stronger solar wind will attenuate the flux of cosmic rays reaching Earth. The key point in this picture is that the cosmic rays are the main physical mechanism controlling the amount of ionization in the troposphere (the bottom 10 kms or so). Thus, a more active sun will reduce the flux of cosmic rays, and with it, the amount of tropospheric ionization. As it turns out, this amount of ionization affects the formation of condensation nuclei required for the formation of clouds in clean marine environment. A more active sun will therefore inhibit the formation of cloud condensation nuclei, and the resulting low altitude marine clouds will have larger drops, which are less white and live shorter, thereby warming Earth.
Today, there is ample evidence to support this picture (a succinct introduction can be found here). For example, it was found that independent galactic induced variations in the cosmic ray flux, which have nothing to do with solar activity do too affect climate as one should expect from such a link. There are many more examples. [Added Note (4 Oct. 2006): These recently published experimental results stroingly point towards the validity of this link, as expected]
So why is this link important for global warming? As previously mentioned, solar activity has been increasing over the 20th century. This can be seen in fig. 5. Thus, we expect warming from the reduced flux of cosmic rays. Moreover, since the cosmic ray flux actually had a small increase between the 1940's and 1970's (as can be seen in the ion chamber data in fig. 6), this mechanism also naturally explains the global temperature decrease which took place during the same period.
Using historic variations in climate and the cosmic ray flux, one can actually quantify empirically the relation between cosmic ray flux variations and global temperature change, and estimate the solar contribution to the 20th century warming. This contribution comes out to be 0.5±0.2°C out of the observed 0.6±0.2°C global warming (Shaviv, 2005).

Fig. 5: Solar activity over the past several centuries can be reconstructed using different proxies. These reconstructions demonstrate that 20th century activity is unparalleled over the past 600 years (previously high solar activity took place around 1000 years ago, and 8000 yrs ago). Specifically, we see sunspots and 10Be. The latter is formed in the atmosphere by ~1GeV cosmic rays, which are modulated by the solar wind (stronger solar wind → less galactic cosmic rays → less 10Be production). Note that both proxies do not capture the decrease in the high energy cosmic rays that took place since the 1970's, but which the ion chamber data does (see fig. 6). (image source: Wikipedia)

Fig. 6: The flux of cosmic rays reaching Earth, as measured by ion chambers. Red line - annual averages, Blue line - 11 yr moving average. Note that ion chambers are sensitive to particles at relatively high energy (several 10's of GeV, which is higher than the energies responsible for the atmospheric ionization [~10 GeV], and much higher than the energies responsible for the 10Be production [~1 GeV]). Plot redrawn using data from Ahluwalia (1997). Moreover, the decrease in high energy cosmic rays since the 1970's is less pronounced in low energy proxies of solar activity, implying that cosmogenic isotopes (such as 10Be) or direct solar activity proxies (e.g., sun spots, aa index, etc) are less accurate in quantifying the solar → cosmic ray → climate link and its contribution to 20th century global warming.
SUMMARY
A CLARIFYING NOTE
A short exposé about the evidence for cosmic rays and climate can be found in this non-technical article. In a while, a details summary of all the evidence pointing to a cosmic ray climate link will appear on this site.
More on the empirical determinations of Earth's climate sensitivity, and in particular, the role of cosmic rays, can be found here (somewhat technical).
The best example of cosmic rays flux induced climate variations, which are not related to solar activity, are the passages of the solar system through the milky way's spiral arms and the clear paleoclimate signal observed.
NOTES AND REFERENCES
All the information about the evidence for global warming, about the anthropogenic climate drivers, and about the numerical models can be found in the Scientific Reports of the Intergovernmental Panel for Climate Change (IPCC). Their reports do not include deficient with regards to all which is related to solar forcing.
Perhaps the most beautiful correlation between a solar activity and climate proxies can be found in the work of U. Neff et al., "Strong coherence between solar variability and the monsoon in Oman between 9 and 6 kyr ago", Nature 411, 290 (2001).
Another beautiful correlation between solar activity and climate can be seen in the work of G. Bond et al., "Persistent Solar Influence on North Atlantic Climate During the Holocene", Science, 294, 2130-2136, (2001).
The detailed analysis behind the empirical determinations of Earth's climate sensitivity, and in particular, the role of cosmic rays, can be found in: Shaviv N., "On Climate Response to Changes in the Cosmic Ray Flux and Radiative Budget" JGR-Space, vol. 110, A08105, 2005, (PDF).
Yes Virginia, the Climate Alarmists are wrong again.
----------------------------------------------------
Natural or Anthropogenic? Which mechanism is responsible for global warming over the 20th century?
According to the common perception, the temperature over the 20th century has been warming, and it is mostly anthropogenic in origin, with greenhouse gases (GHGs) being the dominant driver. Others, usually called "skeptics", challenge this view and instead claim that the temperature variations are all part of natural variability. As I try to demonstrate below, the truth is probably somewhere in between, with natural causes probably being more important over the past century, whereas anthropogenic causes will probably be more dominant over the next century. Following empirical evidence I describe below, about 2/3's (give or take a third or so) of the warming should be attributed to increased solar activity and the remaining to anthropogenic causes.
Like many others, I was personally sure that CO2 is the bad culprit in the story of global warming. But after carefully digging into the evidence, I realized that things are far more complicated than the story sold to us by many climate scientists or the stories regurgitated by the media. In fact, there is much more than meets the eye.
WHAT IS THE EVIDENCE FOR AN ANTHROPOGENIC EFFECT?
The first question we wish to address is whether there is actual evidence indicating that greenhouse gases (GHGs) are responsible for most of the warming. Basically, we observe a temperature rise over the 20th century, and we measure a rise in the global concentration of CO2 and other anthropogenic greenhouse gases. What is the evidence proving that the increase in the GHGs is the cause for the temperature increase?
The truth is that there is no real evidence for this link. Most of the "evidence" often mentioned in the media, is evidence for global warming (e.g., melting of arctic ice-sheets). But who said that this warming (which indeed took place over the 20th century) is because of GHGs? In fact, there is no substantial evidence which proves that CO2 and other GHGs are the primary cause for the warming, and not some other mechanism. You may have seen articles which point to the contrary, that there is clear evidence, but if you dig deeply into them, you will realize that these are merely suggestions for a CO2 climate link and not evidence.
The IPCC writes about fingerprinting the anthropogenic causes. In particular, their report states that (IPCC TAR §12.2.3):
“Different models may give quite different patterns of response for the same forcing, but an individual model may give a surprisingly similar response for different forcings. The first point means that attribution studies may give different results when using signals generated from different models. The second point means that it may be more difficult to distinguish between the response to different factors than one might expect, given the differences in radiative forcing.”
Hence, using models to find fingerprints is hard. If you read the TAR (in particular, chapter 12), you will find claims that the different warming in northern vs. southern latitudes, and tropospheric vs. stratospheric warming can be explained using anthropogenic GHGs operating together with sulphate aerosols, stratospheric ozone and even solar (total irradiance) forcing. Namely, the combination of the drivers can do a descent job in explaining the warming (IPCC TAR §12.4.3.2):
“In summary, the fixed pattern studies indicate that the recent warming is unlikely (bordering on very unlikely) to be due to internal climate variability. A substantial response to anthropogenic greenhouse gases appears to be necessary to account for recent temperature trends but the majority of studies indicate that greenhouse gases alone do not appear to be able to provide a full explanation. Inclusion of the response to the direct effect of sulphate aerosols usually leads to a more satisfactory explanation of the observed changes, although the amplitude of the sulphate signal depends on the model used. These studies also provide some evidence that solar variations may have contributed to the early century warming.”
But in itself it is not proof that GHGs are the major cause. These consistent results only indicate that CO2 can explain the warming, not that it is the only possible explanation. Without other "suspects", it would be incriminating circumstantial evidence. However another very good candidate to explain a large fraction of the warming does exist, as I explain below.

Fig. 1: Correlation between atmospheric CO2 and climate. Nope, it is not proof that CO2 is a major climate driver, since CO2 can be driven by temperature changes. Specifically, warmer oceans requires larger atmospheric partial pressures of CO2 to contain the dissolved gas in them. Of course, some of the temperature could be the result of CO2 amplifications, but there is no way of knowing what fraction.
Of course, the beautiful correlation between CO2 reconstructions and temperature on Earth over the multi-millennial time scale, as it apparent in the figure, is often used to demonstrate how CO2 plays a role in large climate variations. This often misleads the laymen to believe that CO2 is the climate driver, whereas in fact it could be the opposite, that the global temperature affects the equilibrium levels of CO2. In reality it could be somewhere in between, that CO2 is affected by the temperature and that it in turn causes a larger temperature variation. Just by itself, however, this correlation cannot be used to quantify the effect of CO2 on the climate, which could be anywhere from no effect to all the effect. Thus, it is no proof that CO2 is the main cause of the variations over the 20th century. There is no such evidence.
As far as I see it, there are two main reasons why GHGs are blamed as the main cause of global warming even through there is no real incriminating evidence:
- Based on theory, increased levels of GHGs are expected to increase the global temperature.
- There is no other mechanism to blame for the warming. Without any other candidate, the only suspect, i.e. GHGs, must be the cause.
These are reasonable claims, except that they don't work for the case of anthropogenic warming. With regards to the first point, we will see below that even the sign of the anthropogenic contribution is unknown, let alone its magnitude.
As to the second point, there is another good mechanism to blame, that of indirect solar forcing. This mechanism can do just as good a job in explaining 20th century warming as CO2, if not a better one.
THE ANTHROPOGENIC DRIVING - HOW MUCH IS IT?
If we wish to assess theoretically, how much is the anthropogenic contribution to 20th century warming, we have to address two questions, how much is the anthropogenic contribution to the changed radiation budget, and how changes in the radiation budget affect the global temperature. We begin with the anthropogenic contribution.
On average, every square meter of the global surface receives a flux about 240 Watts per square meter. Of course, equatorial surfaces receive more than polar regions, which is why this figure for the radiative flux is an average.
The climatic effect of different global processes is usually quantified with their contribution to a net change in the average radiative flux. For example, doubling the amount of CO2 in the atmosphere changes the radiative budget by about 4 W/m² (3.8 W/m² to be more exact), as if the sun was 4/240*100=1.7% brighter.
The scientific report of the Intergovernmental panel for climate change (IPCC) attempts to summarize the effects of all the drivers. This is displayed in the famous forcing graph below. There are several interesting points one should note. First, there is a large uncertainty in an anthropogenic contribution called the indirect aerosol effect. This effect arises from the fact that increased amounts of small particles in the atmosphere will alter the characteristics of clouds. This is best seen downstream of chimney stacks or in marine clouds in the form of ship tracks. Since cloud formation, and in particular, the characteristics of clouds, is not well understood, the indirect aerosol effect is highly uncertain. The second point to note is that the solar forcing quoted by the IPCC is 0.3 W/m². This does not include the effect of the solar modulated cosmic ray flux, which has ample evidence to support it, and no real evidence to refute it. If one includes the effects of cosmic rays, an additional 1 W/m² should be added because of the increased solar activity (which reduced the flux of cosmic rays reaching Earth, as will be explained below).

Fig. 2: Anthropogenic and Natural contributions to the net radiative forcing. Figure from the IPCC TAR. If one adds their numbers (which are supposed to capture the community's consensus, one finds an Anthropogenic forcing of: 0.8 ± 1.3 W/m² (where the errors were added in quadrature, assuming independence). In other words, the large uncertainty in the indirect aerosol effects, implies that the sign of the Anthropogenic contribution is unknown!
Evidently, we do not know the total Anthropogenic forcing. We don't know its sign. We also don't know its magnitude. All we can say is that it should be somewhere between -1 to +2 W/m². Sounds strange, but we may have actually been cooling Earth (though less likely than warming). It is for this reason that in the 1970's, concerns were raised that humanity is cooling the global temperature. The global temperature appeared to drop between the 1940's and 1970's, and some thought that anthropogenic aerosols could be the cause of the observed global cooling, and that we may be triggering a new ice-age (e.g., see wikiepdia for a summary)
CLIMATE SENSITIVITY
Next, if we wish to translate the anthropogenic contribution to the radiative budget (assuming we knew it!) into a global temperature change, we need to know the global climate sensitivity. That is, we need to know the change λ in °C associated with a radiative forcing of 1 W/m². It can also be quantified with ΔTx2, which is the temperature increase associated with doubling the amount of CO2, i.e., a change of 3.8 W/m² in the radiative budget. If Earth behaved as an ideal black body, its sensitivity would be &lambda≈0.3°C/(W/m²), or ΔTx2≈1.2°C. However, Earth's sensitivity does not necessarily behave like that of an ideal black body. The reason is that as the temperature changes, other variables affecting the temperature change as well. For example, increasing the radiation budget, increases the temperature. This will increase the amount of water vapor in the atmosphere. However, water vapor is a great GHG. So, this will tend to increase the temperature further, thus giving rise to a positive feedback, which increases the sensitivity. On the other hand, the larger amounts of water vapor in the atmosphere imply more cloud cover. Since clouds have a net tendency to cool, this will counter the increase in temperature, thus giving rise to a negative feedback that decreases the sensitivity.
The problem with numerical simulations of climate is that the feedbacks, especially those pertaining to cloud cover, are very poorly understood. As a result, any value in the range of Tx2≈1.5-4.5°C is believed to be possible according to the IPCC. In other words, based on theory (well, numerical simulations to be more exact), the temperature change associated with doubled CO2 is not known to within a factor of 3!
The problem with numerical simulations of climate is that the feedbacks, especially those pertaining to cloud cover, are very poorly understood. As a result, any value in the range of Tx2≈1.5-4.5°C is believed to be possible according to the IPCC. In other words, based on theory (well, numerical simulations to be more exact), the temperature change associated with doubled CO2 is not known to within a factor of 3!
SO, CAN CO2 BE INCRIMINATED?
Evidently, according to the scientists behind the IPCC report, i.e., those who support Kyoto:
- It is not clear how much is the actual anthropogenic contribution to a changed radiation budget (again, even the sign of the anthropogenic effect is not known).
- Even if the anthropogenic radiative forcing was better known, it is theoretically unclear by how much the temperature should have varied in response.
To get the temperature change due to the anthropogenic activity, one has to multiply these two numbers. Obviously, theory cannot tell us how much global warming we should have witnessed and how much we should see in the future. You are more than welcome to look up these numbers in the IPCC report, and realize for yourself that this is an unavoidable conclusion.
Clearly, the incrimination of CO2 (and other GHGs) is primarily because we expect it to warm (see fig. 4), and we do see warming (see fig. 3), but it turns out that there are other suspects.

Fig. 3: Global Warming over the 20th century. Half the increase took place in the beginning of the previous century, long before the bulk of the human influence took place. Is this warming anthropogenic or natural? (image source: Wikipedia)

Fig. 4: Carbon Dioxide in the atmosphere. Just like the global temperature, it increased over the 20th century. Since theoretically we expect the gas to warm, it is often incriminated as the main culprit behind global warming. But there is no direct evidence proving that it is it which is the primary warmer and not another mechanism. (image source: Wikipedia)
AN ALTERNATIVE EXPLANATION FOR GLOBAL WARMING, OR AT LEAST PART OF IT
Solar activity appears to affect climate. This can be seen from many different correlations between solar activity on one hand, and climate on the other. These correlations exist on time scales ranging from the 11-year solar cycle to many millennia (for the two most beautiful correlations, see Neff et al, and Bond et al. in the refs below). Such a link is potentially important for global warming because over the 20th century, solar activity has been increasing.
Because the solar correlated climate variations are large, but the total solar irradiance variations are relatively small (a few 0.1%), the latter are most likely not the explanation of climate variability. Instead, different amplifying mechanisms were suggested, mechanisms which can amplify the non-thermal components of the sun (e.g., UV, X-ray, solar wind) and which can considerably vary between an active sun and a quiet one.
The leading mechanism to explain the large solar induced climate variability is through solar wind modulation of the cosmic ray flux reaching the Earth, which affects climate through modulation of the amount of atmospheric ionization. Over the past decade, many different pieces of evidence added up to a pretty coherent picture.
The activity of the sun manifests its self in many ways. One of them is through a variable solar wind. This flux of energetic particles and entangled magnetic field flows outwards from the sun, and impedes on a flux of more energetic particles, the cosmic rays, which come from outside the solar system. Namely, a more active sun with a stronger solar wind will attenuate the flux of cosmic rays reaching Earth. The key point in this picture is that the cosmic rays are the main physical mechanism controlling the amount of ionization in the troposphere (the bottom 10 kms or so). Thus, a more active sun will reduce the flux of cosmic rays, and with it, the amount of tropospheric ionization. As it turns out, this amount of ionization affects the formation of condensation nuclei required for the formation of clouds in clean marine environment. A more active sun will therefore inhibit the formation of cloud condensation nuclei, and the resulting low altitude marine clouds will have larger drops, which are less white and live shorter, thereby warming Earth.
Today, there is ample evidence to support this picture (a succinct introduction can be found here). For example, it was found that independent galactic induced variations in the cosmic ray flux, which have nothing to do with solar activity do too affect climate as one should expect from such a link. There are many more examples. [Added Note (4 Oct. 2006): These recently published experimental results stroingly point towards the validity of this link, as expected]
So why is this link important for global warming? As previously mentioned, solar activity has been increasing over the 20th century. This can be seen in fig. 5. Thus, we expect warming from the reduced flux of cosmic rays. Moreover, since the cosmic ray flux actually had a small increase between the 1940's and 1970's (as can be seen in the ion chamber data in fig. 6), this mechanism also naturally explains the global temperature decrease which took place during the same period.
Using historic variations in climate and the cosmic ray flux, one can actually quantify empirically the relation between cosmic ray flux variations and global temperature change, and estimate the solar contribution to the 20th century warming. This contribution comes out to be 0.5±0.2°C out of the observed 0.6±0.2°C global warming (Shaviv, 2005).

Fig. 5: Solar activity over the past several centuries can be reconstructed using different proxies. These reconstructions demonstrate that 20th century activity is unparalleled over the past 600 years (previously high solar activity took place around 1000 years ago, and 8000 yrs ago). Specifically, we see sunspots and 10Be. The latter is formed in the atmosphere by ~1GeV cosmic rays, which are modulated by the solar wind (stronger solar wind → less galactic cosmic rays → less 10Be production). Note that both proxies do not capture the decrease in the high energy cosmic rays that took place since the 1970's, but which the ion chamber data does (see fig. 6). (image source: Wikipedia)

As explained above, there is no real direct evidence which can be used to incriminate anthropogenic greenhouse gases as the being the main factor responsible for the observed global warming. The reason these gases were blamed are primarily because (1) we expect them to warm and indeed the global temperature increased, and (2) there is no other mechanism which can explain the warming.
Although this reasoning seems logical, it turns out that (1) We don't even know the sign of the anthropogenic climate driving (because of the unknown indirect aerosol effects), and (2) There is an alternative mechanism which can explain a large part of the warming.
Solar activity can explain a large part of the 20th century global warming, on condition that there is a strong solar/climate link through modulation of the cosmic ray flux and the atmospheric ionization. Evidence for such a link has been accumulating over the past decade, and by now, it is unlikely that it does not exist.
This link also implies that Earth's global temperature sensitivity is also on the low side. Thus, if we double the amount of CO2 by 2100, we will only increase the temperature by about 1°C or so. This is still more than the change over the past century. This is good news, because it implies that future increases in the amount of atmospheric greenhouse gases will not dramatically increase the global temperature, though GHGs will probably be the dominate climate driver.
So, as you may understand, I am quite sure Kyoto is not the right way to go. I should however stress that there are a dozen good reasons why we should strive to burn less fossil fuels.
The two primary reasons why fossil fuels are bad are of course pollution and depletion, while minor reasons include for example the fact that many fossil fuel reserves are controlled by unpleasant governments.
Thus, I am very much in favor, and always have been, in using less fossil fuels and keeping the environment clean (I am proud to say that I grew up in a solar house), but we should do things for the right reasons, not the wrong ones (and I don't see Kyoto addressing the right reasons). I am therefore in favor of developing cheap alternatives such as solar power, wind, and of course fusion reactors (converting Deuterium into Helium) which we should have in a few decades, but this is an altogether different issue.
MORE READING MATERIAL
A short exposé about the evidence for cosmic rays and climate can be found in this non-technical article. In a while, a details summary of all the evidence pointing to a cosmic ray climate link will appear on this site.
More on the empirical determinations of Earth's climate sensitivity, and in particular, the role of cosmic rays, can be found here (somewhat technical).
The best example of cosmic rays flux induced climate variations, which are not related to solar activity, are the passages of the solar system through the milky way's spiral arms and the clear paleoclimate signal observed.
All the information about the evidence for global warming, about the anthropogenic climate drivers, and about the numerical models can be found in the Scientific Reports of the Intergovernmental Panel for Climate Change (IPCC). Their reports do not include deficient with regards to all which is related to solar forcing.
Perhaps the most beautiful correlation between a solar activity and climate proxies can be found in the work of U. Neff et al., "Strong coherence between solar variability and the monsoon in Oman between 9 and 6 kyr ago", Nature 411, 290 (2001).
Another beautiful correlation between solar activity and climate can be seen in the work of G. Bond et al., "Persistent Solar Influence on North Atlantic Climate During the Holocene", Science, 294, 2130-2136, (2001).
The detailed analysis behind the empirical determinations of Earth's climate sensitivity, and in particular, the role of cosmic rays, can be found in: Shaviv N., "On Climate Response to Changes in the Cosmic Ray Flux and Radiative Budget" JGR-Space, vol. 110, A08105, 2005, (PDF).
Friday, September 13, 2019
John Lott's critics get it wrong again - this time on the assault weapons ban
Here is a letter from John Lott and Carl Mody to the New York Times concerning Donohue's and Boulouta's column claiming that the assault weapons ban really did work.
JL and CM point out an obvious fact that invalidates D&B's conclusion. If D&B are aware of it, then they are unethical, hence untrustworthy. If they are not aware of it, then they are incompetent, hence untrustworthy.
Donohue has a long record of critiquing JL's research. JL has, in every case, destroyed these critiques by pointing out fatal flaws in Donohue's analysis.
Donohue lacks credibility.
Here is the letter.
----------------------------------------
Dear Letters Editor:
There’s a serious flaw in John Donohue and Theodora Boulouta’s claims about the 1994 assault weapons ban (“That Assault Weapon Ban? It Really Did Work,” September 4). There are few actual “assault weapons” of any type in their dataset, either pre- or post-ban.
According to data by Mother Jones magazine, there were 3 mass public shootings with assault weapons in the ten years before the assault weapons ban, 2 during the 10-year ban, and 4 in the ten years after. Shootings had to have six or more fatalities to be included. As the authors note, these changes constitute large percentage variations, but are not statistically significant.
If Donohue and Boulouta are right that the ban had an impact, it should have reduced the number of shootings with assault weapons relative to shootings with other guns. While the share of mass public shootings with assault weapons did indeed fall from 30% in the pre-ban period to 25% during the ban, it fell to just 14.8% in the post-ban period. If the ban was really the driving force behind the change, it makes little sense that the sharpest drop would occur after the ban expired.
Sincerely,
John R Lott, Jr., President of the Crime Prevention Research Center
Professor Carl Moody, Department of Economics, College of William & Mary
Wednesday, September 11, 2019
Academic Stupidity and Brainwashing
Here is a column by Walter Williams, Professor of Economics at George Mason University.
WW is on target.
More and more, today's educational system is turning out citizens who will vote in ways that will destroy our freedoms and the remaining cohesiveness of our culture.
-------------------------------------------------
Just when we thought colleges could not spout loonier ideas, we have a new one from American University. They hired a professor to teach other professors to grade students based on their “labor” rather than their writing ability. The professor that American University hired to teach that nonsense is Asao B. Inoue, who is a professor at the University of Washington in Tacoma in interdisciplinary arts and sciences. He is also the director of the university’s writing center. Inoue believes that a person’s writing ability should not be assessed, in order to promote “anti-racist” objectives. Inoue taught American University’s faculty members that their previous practices of grading writing promoted white language supremacy. Inoue thinks that students should be graded on the effort they put into a project.
The idea to bring such a professor to American University, where parents and students fork over $48,459 a year in tuition charges, could not have been something thought up by saner members of its academic community. Instead, it was probably the result of deep thinking by the university’s diversity and campus life officials. Inoue’s views are not simply extreme but possibly hostile to the academic mission of most universities. Forgiving and ignoring a students’ writing ability would mostly affect black students. White students’ speaking and writing would be judged against the King’s English, defined as standard, pure or correct English grammar.
Professor Noam Chomsky, called the father of modern linguistics, formulated the generative theory of language. According to his theory, the most basic form of language is a set of syntactic rules that is universal for all humans and that underlies the grammar of all human languages. We analyze and interpret our environment with words and sentences in a structured language. Oral and written language provides a set of rules that enables us to organize thoughts and construct logical meaning with our thoughts.
Not holding students accountable to proper grammar does a disservice to those students who overall show poor writing abilities. When or if these students graduate from college, they are not going to be evaluated in their careers by Inoue’s tailored standards. They will be judged according to their objective abilities, and it probably follows that if they fail to meet those objective standards, the standards themselves will be labeled as racist.
There’s another very dangerous bit of academic nonsense happening, this time at the K-12 level of education. One America News Network anchor interviewed Mary Clare Amselem, education specialist at the Heritage Foundation, about the California Department of Education’s proposed ethnic studies curriculum. The proposed ethnic studies curriculum would teach children that capitalism and father figures are racist.
The Ethnic Studies Model Curriculum also includes gross anti-Israel bias and teaches about a Palestinian-led anti-Israel initiative called Boycott, Divestment and Sanctions. The curriculum also has students study issues of police brutality and asks teachers to find incidents of bias by police in their own communities. According to an article by Shelby Talcott in The Stream, California’s proposed curriculum called for students to study lawmakers such as Democratic Minnesota Rep. Ilhan Omar and Democratic Michigan Rep. Rashida Tlaib, both of whom have supported the BDS movement and have been accused of anti-Semitic rhetoric.
The proposed ethnic studies proposal has been removed from the California Department of Education website. House Minority Leader Kevin McCarthy, R-Calif., said, “While I am relieved that California made the obvious decision to revisit this wholly misguided proposal, we need to know why and how a blatantly anti-Semitic, anti-Israel, factually inaccurate curriculum made its way through the ranks of California’s Department of Education.” He added, “This was not simply an oversight — the California Department of Education’s attempt to institutionalize anti-Semitism is not only discriminatory and intolerant, it’s dangerous.”
Brainwashing our youngsters is a serious matter. The people responsible for the California Department of Education’s proposal ought to be summarily fired.
Tuesday, September 10, 2019
Hurricanes and Climate Change - The Climate Change Alarmists Are Wrong Again
Judith Curry is a world renowned climate scientist. Here is a link to a recent paper of hers titled "Hurricanes and Climate Change".
JC's view conflicts sharply with the alarmist statements you hear from the media, politicians, and many "climate scientists". I have put the latter in quotes because so many of them have no credible reason for their alarmist position; hence are not scientists in the true sense.
Some excerpts from JC's paper follow.
-----------------------------------
Executive summary
This Report assesses the scientific basis for projections of future hurricane activity. The Report evaluates the assessments and projections from the Intergovernmental Panel on Climate Change (IPCC) and recent national assessments regarding hurricanes. The uncertainties and challenges at the knowledge frontier are assessed in the context of recent research, particularly with regards to natural variability. The following four questions frame this Report:
1 Is recent hurricane activity unusual?
In the North Atlantic, all measures of hurricane activity have increased since 1970, although comparably high levels of activity also occurred during the 1950’s and 1960’s. Geologic evidence indicates that the current heightened activity in the North Atlantic is not unusual, with a ‘hyperactive period’ apparently occurring from 3400 to 1000 years before present. Prior to the satellite era (1970’s), there are no reliable statistics on global hurricane activity. Global hurricane activity since 1970 shows no significant trends in overall frequency, although there is some evidence of a small increase in the number of major hurricanes.
2 Have hurricanes been worsened by man-made global warming?
Any recent signal of increased hurricane activity has not risen above the background variability of natural climate variations. At this point, there is no convincing evidence that man-made global warming has caused a change in hurricane activity.
3. Have hurricane landfall impacts been worsened by man-made global warming?
Of recent impactful U.S. land-falling hurricanes, only the rainfall in Hurricane Harvey is unusual in context of the historical record. Warmer sea surface temperatures are expected to contribute to an overall increase in hurricane rainfall, although hurricane induced rainfall and flooding is dominated by natural climate variability. Storm surge risk is increasing slightly owing to the slow creep of sea level rise. The extent to which the recent increase in ocean temperatures and sea level rise can be attributed to man-made global warming is disputed. The primary driver for increased economic losses from land-falling hurricanes is the massive population buildup along coastlines.
4. How will hurricane activity change during the 21st century?
----------
While an increase in hurricane intensity has long been hypothesized to occur as global sea surface temperatures increase, identification of any significant trend in the hurricane data is hampered by a short data record and substantial natural variability.
Analyses of both global and regional variability and trends of hurricane activity provide the basis for detecting changes and understanding their causes.
The relatively short historical record of hurricane activity, and the even shorter record from the satellite era, is not sufficient to assess whether recent hurricane activity is unusual for the current interglacial period. Results from paleotempestology analyses in the North Atlantic at a limited number of locations indicate that the current heightened activity is not unusual, with a hyperactive period apparently occurring from 3400 to 1000 years before present.
Global hurricane activity since 1970 shows no significant trends in overall frequency. There is some evidence of increasing numbers of major hurricanes and of an increase in the percentage of Category 4 and 5 hurricanes, although the quality of intensity data in some regions prior to 1988 is disputed.
In the North Atlantic, all measures of hurricane activity have increased since 1970, although comparably high levels of activities also occurred during the 1950’s and 1960’s.
2. Have hurricanes worsened from man-made global warming?
3. Have hurricane landfall impacts been worsened by man-made global warming?
4. How will hurricane activity change during the 21st century?
JC's view conflicts sharply with the alarmist statements you hear from the media, politicians, and many "climate scientists". I have put the latter in quotes because so many of them have no credible reason for their alarmist position; hence are not scientists in the true sense.
Some excerpts from JC's paper follow.
-----------------------------------
Executive summary
This Report assesses the scientific basis for projections of future hurricane activity. The Report evaluates the assessments and projections from the Intergovernmental Panel on Climate Change (IPCC) and recent national assessments regarding hurricanes. The uncertainties and challenges at the knowledge frontier are assessed in the context of recent research, particularly with regards to natural variability. The following four questions frame this Report:
1 Is recent hurricane activity unusual?
In the North Atlantic, all measures of hurricane activity have increased since 1970, although comparably high levels of activity also occurred during the 1950’s and 1960’s. Geologic evidence indicates that the current heightened activity in the North Atlantic is not unusual, with a ‘hyperactive period’ apparently occurring from 3400 to 1000 years before present. Prior to the satellite era (1970’s), there are no reliable statistics on global hurricane activity. Global hurricane activity since 1970 shows no significant trends in overall frequency, although there is some evidence of a small increase in the number of major hurricanes.
2 Have hurricanes been worsened by man-made global warming?
Any recent signal of increased hurricane activity has not risen above the background variability of natural climate variations. At this point, there is no convincing evidence that man-made global warming has caused a change in hurricane activity.
3. Have hurricane landfall impacts been worsened by man-made global warming?
Of recent impactful U.S. land-falling hurricanes, only the rainfall in Hurricane Harvey is unusual in context of the historical record. Warmer sea surface temperatures are expected to contribute to an overall increase in hurricane rainfall, although hurricane induced rainfall and flooding is dominated by natural climate variability. Storm surge risk is increasing slightly owing to the slow creep of sea level rise. The extent to which the recent increase in ocean temperatures and sea level rise can be attributed to man-made global warming is disputed. The primary driver for increased economic losses from land-falling hurricanes is the massive population buildup along coastlines.
4. How will hurricane activity change during the 21st century?
Recent assessment reports have concluded that there is low confidence in projections of future changes to hurricane activity. Any projected change in hurricane activity is expected to be small relative to the magnitude of natural variability in hurricane activity.
----------
Over the years, the way that hurricanes have been observed has changed radically. As a result, many hurricanes are now recorded that would have been missed in the past. Furthermore, satellites are now able to continually assess wind speeds, thus recording peak wind speeds that may have been missed in pre-satellite days. Unfortunately, temporally inconsistent and potentially unreliable global historical data hinder detection of trends in tropical cyclone activity. ----------
While an increase in hurricane intensity has long been hypothesized to occur as global sea surface temperatures increase, identification of any significant trend in the hurricane data is hampered by a short data record and substantial natural variability.
----------
A positive rate of hurricane intensification has been identified in recent decades in the Atlantic. Whether this trend is associated with natural variability or warming is unknown. Global data on rates of hurricane intensification is ambiguous.
----------
In recent decades, the Northern Hemisphere Pacific Ocean has seen a poleward migration in hurricane track location and location of maximum intensity, and also a slowing of hurricane motion. This migration has been attributed primarily to natural variability of the ocean circulations.
----------
Outside the North Atlantic, and particularly in the Southern Hemisphere, the historical data sets are fairly meager and of questionable quality, particularly with regards to intensity. There is no evidence of trends that exceeds natural variability.
----------
All measures of Atlantic hurricane activity show a significant increase since 1970. However, high values of hurricane activity (comparable to the past two decades) were also observed during the 1950’s and 1960’s, and by some measures also in the late 1920’s and 1930’s.
----------
There has not been a timeline or synthesis of the Atlantic hurricane paleotempestology results for the past five thousand years, either regionally or for the entire coastal region. However, it is clear from these analyses that significant variability of landfall probabilities occurs on century to millennial time scales. There appears to have been a broad hyperactive period from 3400 to 1000 years B.P. High activity persisted in the 26 Gulf of Mexico until 1400 AD, with a shift to more frequent severe hurricane strikes from the Bahamas to New England occurring between 1400 and 1675 AD. Since 1760, there was a gradual decline in activity until the 1990’s.
----------
3.5 ConclusionsAnalyses of both global and regional variability and trends of hurricane activity provide the basis for detecting changes and understanding their causes.
The relatively short historical record of hurricane activity, and the even shorter record from the satellite era, is not sufficient to assess whether recent hurricane activity is unusual for the current interglacial period. Results from paleotempestology analyses in the North Atlantic at a limited number of locations indicate that the current heightened activity is not unusual, with a hyperactive period apparently occurring from 3400 to 1000 years before present.
Global hurricane activity since 1970 shows no significant trends in overall frequency. There is some evidence of increasing numbers of major hurricanes and of an increase in the percentage of Category 4 and 5 hurricanes, although the quality of intensity data in some regions prior to 1988 is disputed.
In the North Atlantic, all measures of hurricane activity have increased since 1970, although comparably high levels of activities also occurred during the 1950’s and 1960’s.
----------
The observational database (since 1970 or even 1850) is too short to assess the full impact of natural internal variability associated with large-scale ocean circulations. Paleotempestology analyses indicate that recent hurricane activity is not unusual. Given the limited data record and its quality, there is no evidence of any changes in global or regional hurricane activity that exceeds natural variability.
----------
With regards to the observed global warming of the oceans, it is clear that manmade contributions to atmospheric CO2 do not provide a complete explanation of this warming. Solar variations, volcanic eruptions and the large-scale ocean circulation patterns also have a substantial influence on temperature variations in the global oceans.
----------
Atlantic hurricane processes are influenced substantially by the natural modes of ocean circulation variability in the Atlantic, notably the Atlantic Multidecadal Oscillation and the Atlantic Meridional Mode.
----------
Hurricanes in the Atlantic and Pacific are influenced substantially by the natural modes of ocean circulation variability in the Pacific. These modes include ENSO and Modoki, and also the Pacific Decadal Oscillation and the North Pacific Gyre Oscillation.
----------
Global climate models are currently of limited use in hurricane attribution studies. High-resolution models used to simulate individual hurricanes are being used to perform controlled experiments that focus on specific events and the complexities of relevant physical processes. However, definitive conclusions regarding the impact of man-made warming on hurricanes cannot be determined from these simulations, given the current state of model development and technology.
----------
In summary, there is no observed trend in hurricane activity that has risen above the background variability of natural processes. It is possible that man-made climate change may have caused changes in hurricane activity that are not yet detectable due to the small magnitude of these changes compared to estimated natural variability, or due to observational limitations. But at this point, there is no convincing evidence that man-made global warming has caused a change in hurricane activity.
----------
U.S. land-falling hurricanes show substantial year-to-year and decadal variability, associated primarily with ENSO and the Atlantic Multi-decadal Oscillation. Over the last century, there is a slight overall negative trend in the total number of hurricanes and major hurricanes striking the U.S. The number of major hurricanes striking the U.S. in recent decades is lower than the 1930’s, 1940’s and 1950’s. During the period 2006-2016, no major hurricanes struck the continental U.S.
----------
No trend in Caribbean landfalls has been observed. ENSO and Atlantic Multidecadal Oscillation dominate the variability of Caribbean landfalls. Historical records show that the time span 1968–1977 was probably the most inactive period since the islands were settled in the 1620s and 1630s.
----------
There are substantial challenges in constructing a homogeneous global hurricane landfall data set. Since 1970, the global frequency of total and major hurricane landfalls shows considerable interannual variability, but no significant linear trend. There is substantial regional variability in hurricane landfalls, primarily associated with ENSO phase.
----------
Examination of the number and intensity of historical Texas land-falling hurricanes shows no relationship with surface temperatures in the Gulf of Mexico. Harvey’s extreme rainfall has been linked to unusually high temperatures in the Gulf of Mexico that were associated primarily with local ocean circulation patterns. It has been estimated that at most about 2 inches of Hurricane Harvey’s peak amount of 60 inches can be linked with man-made global warming.
----------
Hurricane Irma set several intensity records, although these have not been linked in any way to sea surface temperature or man-made global warming. Historical data of Florida land-falling major hurricanes indicate no trends in either frequency or intensity.
----------
Of the four hurricanes considered here, only the rainfall in Hurricane Harvey passes the detection test, given that it is an event unprecedented in the historical record for a continental U.S. landfalling hurricane. Arguments attributing the high levels of rainfall to near record ocean heat content in the western Gulf of Mexico are physically plausible. The extent to which the high value of ocean heat content in the western Gulf of Mexico can be attributed to manmade global warming is debated. Owing to the large interannual and decadal variability in the Gulf of Mexico (e.g. ENSO), it is not clear that a dominant contribution from manmade warming can be identified against the background internal climate variability.
----------
The climate model projections of 21st century surface temperature and sea level rise are contingent on the following assumptions [IPCC AR5 WG1 Section12.2.3]: 1. Emissions follow the specified concentration pathways (RCP). 2. Climate models accurately predict the amount of warming in 21st century. 3. Solar variability follows that of the late 20th century, which coincided with a Grand Solar Maximum. 4. Natural internal variability of ocean circulations does not impact temperature or sea level rise on these timescales. 5. Major volcanic eruptions are not considered. Each of these contingent assumptions, with the possible exception of natural internal variability, likely contributes to a warm bias in the 21st century climate model projections.
----------
On timescales at least to 2050, variations in hurricane activity are expected to be dominated by natural variability, relative to any secular warming trends. A forthcoming shift to the cold phase of the Atlantic Multidecadal Oscillation – on a time scale of a decade or so – would result in fewer major hurricanes, lower values of Accumulated Cyclone Energy and fewer landfalls striking Florida, the U.S. east coast and the Caribbean. At some point in the coming decades, we can also anticipate a shift in the Pacific Decadal Oscillation towards more frequent La Niña events, which are associated with more activity in the Atlantic but suppressed activity in the Pacific.
----------
8. Conclusions
Numerous assessments and reviews have been conducted of the possible role of manmade global warming on global and regional hurricane activity. Overall, the ‘consensus’ among scientists on the possible role of manmade global warming on hurricane activity has been essentially unchanged over the past 15 years.
This Special Report on Hurricanes and Climate Change is distinguished from recent assessments by a focus on hurricane aspects that contribute to landfall impacts, and an increased emphasis on paleotempestology and interpretation of natural variability. Arguments have been presented supporting the important and even dominant role that natural processes play in global and regional hurricane variations and change.
1. Is recent hurricane activity unusual? In the North Atlantic, all measures of hurricane activity have increased since 1970, although comparably high levels of activity also occurred during the 1950’s and 1960’s. Geologic evidence indicates that the current heightened activity in the North Atlantic is not unusual, with a hyperactive period apparently occurring from 3400 to 1000 years before present. Prior to the satellite era (1970’s), there are no reliable statistics on global hurricane activity. Global hurricane activity since 1970 shows no significant trends in overall frequency, although there is some evidence of increasing numbers of major hurricanes.
2. Have hurricanes worsened from man-made global warming?
Models and theory suggest that hurricane intensity and rainfall should increase in a warming climate. Convincing attribution of any changes to man-made global warming requires that a change in hurricane characteristics be identified from observations, with the change exceeding natural variability.
Any signal of recent increased hurricane activity has not risen above the background variability of natural climate variations. At this point, there is no convincing evidence that man-made global warming has caused a change in hurricane activity.
While there is much physically-plausible speculation among scientists regarding impacts of global warming on hurricanes, most of this speculation has weak justification when the observational record is examined in context of natural climate variability.
3. Have hurricane landfall impacts been worsened by man-made global warming?
Worldwide economic losses from landfalling tropical cyclones have increased in recent decades. In addition to the frequency and intensity of landfalling hurricanes, the following variables contribute to damage: horizontal size of the hurricane, forward speed of motion near the coast, storm surge and rainfall.
Of the recent impactful U.S. landfalling hurricanes, only the rainfall in Hurricane Harvey is unusual in context of the historical record of U.S. landfalling hurricanes. Warmer sea surface temperatures are expected to contribute to an overall increase in hurricane rainfall, although hurricane-induced rainfall and flooding is dominated by natural climate variability. Storm surge risk is increasing owing to the slow creep of sea level rise. The extent to which the recent increase in ocean temperatures and sea level rise can be attributed to man-made global warming is disputed. The primary driver for increased economic losses from landfalling hurricanes is the massive population buildup along the coasts.
4. How will hurricane activity change during the 21st century?
Recent assessment reports have concluded that there is low confidence in projections of future changes to hurricane activity. Any projected change in hurricane activity is expected to be small relative to the magnitude of natural variability in hurricane activity.
Decadal variability of hurricane activity is expected to provide much greater variability than the signal from global warming. In particular, a shift to the cold phase of Atlantic Multidecadal Oscillation (AMO) is anticipated within the next 15 years. All other things being equal (such as the frequency of El Niño and La Niña events), the cold phase of AMO harkens reduced Atlantic hurricane activity and fewer landfalls for Florida, the east coast and the Caribbean.
Substantial advances have been made in recent years in the ability of climate models to simulate the variability of hurricanes. However, inconsistent hurricane projections have emerged from modeling studies. Progress continues to be made, particularly with models that are coupled to the ocean. Apart from the challenges of simulating hurricanes in climate models, the amount of warming projected by climate models for the 21st century is associated with deep uncertainty. Hence, projections of future hurricane activity are contingent on the amount of predicted global warming being correct.
Sunday, September 08, 2019
A respected climate scientist's perspective on alarmist climate scientists
Judith Curry is a leading climate scientist. Here is an excerpt from her blog concerning climate scientist alarmists.
-------------------------------------------
JC message to the ‘alarmism enforcers’
Well there’s probably a better chance of President Trump listening to me than there is of the climate scientists who are alarmism enforcers listening to me, but here goes anyways.
Scientists are gonna do what scientists are gonna do. Short of plagiarism, fabrication, and falsification, it seems no one cares what they do. What astonishes me is that there is no pushback from their universities and professional societies on this unethical behavior. Instead these activists are actually rewarded by the universities and professional societies.
The damage that these activist scientists are doing to climate science and the public debate on climate change is incalculable.
-------------------------------------------
JC message to the ‘alarmism enforcers’
Well there’s probably a better chance of President Trump listening to me than there is of the climate scientists who are alarmism enforcers listening to me, but here goes anyways.
- Your behavior is violating the norms of science, and in my opinion is unethical:
- failure to acknowledge uncertainty and low levels of confidence in much of the research surrounding hurricanes and climate change.
- cherry picking research that supports your personal narrative of alarm, without acknowledging disagreement among scientists and other research and assessment reports that do not support your narrative of alarm.
- misleading the public and policy makers as a result of the above two practices
- and last but not least, bullying other respected scientists who have different perspectives on evaluating the evidence.
Scientists are gonna do what scientists are gonna do. Short of plagiarism, fabrication, and falsification, it seems no one cares what they do. What astonishes me is that there is no pushback from their universities and professional societies on this unethical behavior. Instead these activists are actually rewarded by the universities and professional societies.
The damage that these activist scientists are doing to climate science and the public debate on climate change is incalculable.
Tuesday, September 03, 2019
Researchers from Public Health, Criminology, and Economics have different views on gun control
Here is a link to a paper, "Do Researchers from Different Fields have a Consensus on Gun Control Laws and do Registered Voters Agree with any of them?
The authors are:
Arthur Z. Berg, MD Associate Professor Emeritus, Department of Psychiatry, Harvard Medical School.
Hundreds of millions of dollars go to firearms research on crime, suicides, and accidental
deaths, but the vast majority of the money, particularly government money, is being spent on
public health research. We got a response rate of over 43%, or 120, from the 277 researchers
we approached, and we found large statistically significant differences in the views of academic
researchers in criminology, economics, and public health on 33 different gun control policies for
both mass public shootings and murder will reduce crime and save lives. Our sample is much
larger than two surveys of 32 researchers by the New York Times. While none of our groups are
quite as supportive of gun control as reported by the Times, public health researchers come
closest.
Here, we compare the views of public health researchers with those of criminologists and economists on a wide range of gun control policies. Specifically, we ask academics to assess the impact of these policies on mass public shootings and murder rates. Our survey examines a very broad range of topical gun control policies and issues.
It’s only natural for there to be a diversity of views across academic disciplines that differ fundamentally in their theoretical foundations and research methodologies. No one should be surprised that criminologists, economists, and public health researchers would disagree about how
to approach public policy. Economics is based on the “law of demand,” which holds that as
something becomes more costly, people do less of it. Applied to crime, this concept means that
crime will decrease as punishments become more severe or the probability of arrest and conviction
increases. In sharp contrast to criminologists and public health researchers, all empirical
work by economists on crime includes law enforcement as a key factor.
In our survey below, we obtained responses from 32 economists – the same size as the Times’
entire panel of researchers and more than 10 times as many Ph.D. economists. We also have
more criminologists (38) and public health researchers (50) than either the New York Times or
the HICRC surveyed. Altogether, we have almost four times as many respondents as the number
of experts on the Times’ panel.
Respondents were asked to rate the effectiveness of each policy on a scale of 1 to 10 -- first in
terms of whether it would reduce “murder rates,” and then whether it would reduce “mass
public shootings.” The scale ran from “1” as not effective at all to “10” as extremely effective.
Table 1: List of questions
Respondents were asked to evaluate 33 gun control policies. First, they were asked to
evaluate each policy’s effectiveness at reducing mass public shootings, and then its effectiveness
in reducing murder rates. Two distinct types of policy questions were included: [1] 25 questions focused on increasing governmental restrictions on firearms by civilians, and [2] 8 questions asked about the effectiveness of policies that relaxed or decreased governmental restrictions on firearms or drugs.
25 questions focused on increasing governmental restrictions on firearms by civilians. 20 of these matched the policies previously included by the New York Times in their studies:
1. Assault weapons ban
2. Banning the sale and ownership of all ammunition magazines with capacities
greater than 10 bullets
3. Bar sales to convicted stalkers
4. Bar sales to people deemed dangerous by a mental health provider
Five additional questions included on increasing government restrictions:
1. Allow judges to take away a person's guns based on "probable cause" that a person
might commit a crime
Eight additional questions were asked about policies that relaxed or decreased governmental
restrictions. This provides insight into how experts evaluate policies that encourage individual freedom and self-help.
1. Allow teachers with permits to carry concealed handguns at K-12 schools and
college campuses
will work, but they rank policies similarly. Both have the same top four preferred policies for
stopping mass public shootings. American criminologists rate the following policies most highly:
allow K-12 teachers to carry concealed handguns (with a survey score of 6), allow military personnel
to carry on military bases (5.6), encourage the elimination of gun-free zones (5.3), and
relax OSHA regulations that pressure companies to create gun-free zones (5). The top four for
economists are the same, but in different order: encourage the elimination of gun-free zones
(7.9), relax OSHA regulations that pressure companies to create gun-free zones (7.8), allow K-12
teachers to carry concealed handguns (7.7), and allow military personnel to carry on military
bases (7.7).
By contrast, public health researchers place these same policies near the bottom of their list.
Their top policy choice of barring gun sales to people deemed dangerous by a mental health
provider is the fifth most valued policy by criminologists (4.88), but their other top policies
aren’t viewed positively by criminologists. Their second through fourth top-ranked policies are
banning magazines that can hold more than 10 bullets (6.2), banning semi-automatic guns (6.1),
and prohibiting assault weapon (5.98). All of these policies involve highly restrictive bans. For Criminologists, these were their 21st (2.6), 20th (2.8), and 10th (3) ranked policies. There was an
The patterns are similar when these different groups rate the effectiveness of policies at reducing
murder rates. While the proposal ranked most favorably by criminologists is reducing government-
imposed costs of acquiring guns (5.2), economists want to relax OSHA restrictions that
interfere with companies setting rules for people having guns (7.1) and public health people
want to prevent the sales of a firearm to people convicted of violent misdemeanors (7.3).


The authors are:
Arthur Z. Berg, MD Associate Professor Emeritus, Department of Psychiatry, Harvard Medical School.
John R. Lott, Jr. President, Crime Prevention Research Center.
Gary A. Mauser Professor Emeritus, Department of Marketing, Simon Fraser University.
Gary A. Mauser Professor Emeritus, Department of Marketing, Simon Fraser University.
The paper surveys views from researchers in three fields - Public Health, Criminology, and Economics. Researchers in Criminology and Economics tend to agree on what works. Researchers in Public Health have very different views. The latter also tend to use inappropriate statistical methods that make their results (and in my opinion, their views) problematic.
Here are some excerpts.
------------------------------------------
Executive SummaryHundreds of millions of dollars go to firearms research on crime, suicides, and accidental
deaths, but the vast majority of the money, particularly government money, is being spent on
public health research. We got a response rate of over 43%, or 120, from the 277 researchers
we approached, and we found large statistically significant differences in the views of academic
researchers in criminology, economics, and public health on 33 different gun control policies for
both mass public shootings and murder will reduce crime and save lives. Our sample is much
larger than two surveys of 32 researchers by the New York Times. While none of our groups are
quite as supportive of gun control as reported by the Times, public health researchers come
closest.
- We find that Economists and to a lesser extent criminologists rank order the efficacy of gun control policies in the opposite order that public health researcher do. Using the New York Times survey of registered voters shows that their rank order is random when compared to any group of experts.
- Regarding proposals that can reduce mass public shootings, while public health researchers give a score of at least 5.5 on a 1 to 10 scale for two types of gun control regulations (gun and ammunition bans as well as universal background checks), criminologists and economists only give that high of a score to just one type of gun regulation (eliminating gun-free zones).
- Regarding proposals that can reduce murder rates, while public health researchers give a score of at least 5.5 on a 1 to 10 scale for one type of gun control regulation (universal background checks), economists only give that high of a score to just one kind of gun regulation (eliminating gun-free zones).
- As a group, criminologists are generally extremely skeptical of gun control regulations. In none of the broad overall categories of gun control do either group give a score of at least 3.0 on a 1 to 10 scale for Red Flag laws, gun bans, universal background checks, or licensing and regulations.
- Economists are even more skeptical of gun control regulations. In none of the broad overall categories of gun control do either group give a score of at least 2.0 on a 1 to 10 scale for Red Flag laws, gun bans, universal background checks, or licensing and regulations.
It’s only natural for there to be a diversity of views across academic disciplines that differ fundamentally in their theoretical foundations and research methodologies. No one should be surprised that criminologists, economists, and public health researchers would disagree about how
to approach public policy. Economics is based on the “law of demand,” which holds that as
something becomes more costly, people do less of it. Applied to crime, this concept means that
crime will decrease as punishments become more severe or the probability of arrest and conviction
increases. In sharp contrast to criminologists and public health researchers, all empirical
work by economists on crime includes law enforcement as a key factor.
Statistical techniques also vary greatly across the groups, with much of public health research
still relying on purely cross-sectional evidence. By contrast, such evidence is almost unheard of
among economists in the last couple of decades. Economists would argue that cross-sectional
comparisons cannot properly account for all of the differences across places.
still relying on purely cross-sectional evidence. By contrast, such evidence is almost unheard of
among economists in the last couple of decades. Economists would argue that cross-sectional
comparisons cannot properly account for all of the differences across places.
Economists are much more focused on issues such as substitutability in methods of committing
suicide or murder. They look at total suicide or murder rates, whereas public health researchers
focus heavily on firearm suicides and homicides. Economists would argue that even if firearm
suicides significantly declined after a particular gun control law, most or even all of the people
who would have used firearms might have picked another method of killing themselves.
Unlike most economists and criminologists, public health academics also see themselves as
more than just researchers. “Public health academics are expected not just to study problems,
but also to reduce them,” Hemenway and Miller (2019) note. “The dual mission of public health
academics is reflected by the mixture of academics, advocates, practitioners, and policymakers
who attend the annual American Public Health Association meetings.”
In our survey below, we obtained responses from 32 economists – the same size as the Times’
entire panel of researchers and more than 10 times as many Ph.D. economists. We also have
more criminologists (38) and public health researchers (50) than either the New York Times or
the HICRC surveyed. Altogether, we have almost four times as many respondents as the number
of experts on the Times’ panel.
Respondents were asked to rate the effectiveness of each policy on a scale of 1 to 10 -- first in
terms of whether it would reduce “murder rates,” and then whether it would reduce “mass
public shootings.” The scale ran from “1” as not effective at all to “10” as extremely effective.
Table 1: List of questions
Respondents were asked to evaluate 33 gun control policies. First, they were asked to
evaluate each policy’s effectiveness at reducing mass public shootings, and then its effectiveness
in reducing murder rates. Two distinct types of policy questions were included: [1] 25 questions focused on increasing governmental restrictions on firearms by civilians, and [2] 8 questions asked about the effectiveness of policies that relaxed or decreased governmental restrictions on firearms or drugs.
25 questions focused on increasing governmental restrictions on firearms by civilians. 20 of these matched the policies previously included by the New York Times in their studies:
1. Assault weapons ban
2. Banning the sale and ownership of all ammunition magazines with capacities
greater than 10 bullets
3. Bar sales to convicted stalkers
4. Bar sales to people deemed dangerous by a mental health provider
5. Implementing a national "buy-back" program for all banned firearms and magazines,
where the government pays people to turn in illegal guns
where the government pays people to turn in illegal guns
6. Limiting the amount of ammunition you can purchase within a given time period
7. One gun per month purchase limit
8. Preventing sales of all firearms to people who have been convicted of violent
misdemeanors
misdemeanors
9. Requiring a mandatory waiting period of three days before a purchased gun can
be taken home
be taken home
10. Requiring all gun owners to possess a license for their firearm
11. Requiring all gun owners to register their fingerprints
12. Requiring all guns to microstamp each bullet with a mark that uniquely matches
the gun and bullet
the gun and bullet
13. Requiring reports of lost or stolen guns
14. Requiring that all firearms be recorded in a national registry
15. Requiring that all gun buyers demonstrate a "genuine need" for a gun, such as a
law enforcement job or hunting
law enforcement job or hunting
16. Requiring that all gun owners store their guns in a safe storage unit
17. Requiring that gun buyers complete safety training and a test for their specific
firearm
firearm
18. Semiautomatic gun ban
19. Universal background checks (Checks on private transfers) for gun buyers
20. Universal background checks (Checks on private transfers) for ammo buyers
Five additional questions included on increasing government restrictions:
1. Allow judges to take away a person's guns based on "probable cause" that a person
might commit a crime
2. Allow judges to take away a person's guns based on the "Preponderance of the
evidence" that a person might commit a crime
evidence" that a person might commit a crime
3. Allow judges to take away a person's guns without a hearing
4. Allow judges to take away a person's guns without requiring testimony by mental
health experts
health experts
5. Requiring all gun owners to provide login information for their social media accounts
Eight additional questions were asked about policies that relaxed or decreased governmental
restrictions. This provides insight into how experts evaluate policies that encourage individual freedom and self-help.
1. Allow teachers with permits to carry concealed handguns at K-12 schools and
college campuses
2. Allow the military personnel at military bases to again carry guns
3. Authorizing nationwide stand-your-ground laws that allow people to defend
themselves using lethal force, without requiring a person to first retreat as far as possible
themselves using lethal force, without requiring a person to first retreat as far as possible
4. Encouraging public places to eliminate gun-free zones for concealed handgun
permit holders
permit holders
5. Legalizing drugs to eliminate drug gangs as a major source of illegal guns
6. National reciprocity for permitted concealed handguns
7. Reducing the government-imposed costs of acquiring guns in terms of background
checks, licensing fees, and costs of concealed handgun permits.
checks, licensing fees, and costs of concealed handgun permits.
8. Relaxing OSHA restrictions to let companies determine if people can carry concealed
handguns in workplace settings
handguns in workplace settings
----------
Criminologists and economists differ somewhat in how strongly they feel that different policieswill work, but they rank policies similarly. Both have the same top four preferred policies for
stopping mass public shootings. American criminologists rate the following policies most highly:
allow K-12 teachers to carry concealed handguns (with a survey score of 6), allow military personnel
to carry on military bases (5.6), encourage the elimination of gun-free zones (5.3), and
relax OSHA regulations that pressure companies to create gun-free zones (5). The top four for
economists are the same, but in different order: encourage the elimination of gun-free zones
(7.9), relax OSHA regulations that pressure companies to create gun-free zones (7.8), allow K-12
teachers to carry concealed handguns (7.7), and allow military personnel to carry on military
bases (7.7).
By contrast, public health researchers place these same policies near the bottom of their list.
Their top policy choice of barring gun sales to people deemed dangerous by a mental health
provider is the fifth most valued policy by criminologists (4.88), but their other top policies
aren’t viewed positively by criminologists. Their second through fourth top-ranked policies are
banning magazines that can hold more than 10 bullets (6.2), banning semi-automatic guns (6.1),
and prohibiting assault weapon (5.98). All of these policies involve highly restrictive bans. For Criminologists, these were their 21st (2.6), 20th (2.8), and 10th (3) ranked policies. There was an
even larger gap between economists and public health researchers.
The patterns are similar when these different groups rate the effectiveness of policies at reducing
murder rates. While the proposal ranked most favorably by criminologists is reducing government-
imposed costs of acquiring guns (5.2), economists want to relax OSHA restrictions that
interfere with companies setting rules for people having guns (7.1) and public health people
want to prevent the sales of a firearm to people convicted of violent misdemeanors (7.3).
----------


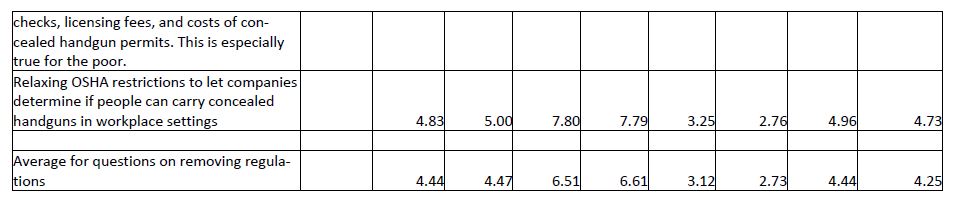


Monday, September 02, 2019
The Climate Change Alarmists are missing solar forcing
Here is a link to a blog entry by Judith Curry, a renowned expert on climate.
She provides more evidence that the Climate Change Alarmists and much of the climate change scientific community are missing the importance of solar forcing on climate.
Here are some excerpts.
------------------------------------------
El Niño Southern Oscillation (ENSO) is the main source of interannual tropical climate variability with an important effect on global temperature and precipitation. Paleoclimatic evidence supports a relationship between ENSO and solar forcing. Moy et al. (2002) attribute the long-term increasing trend in ENSO frequency to orbitally induced changes in insolation (figure 1). The ENSO proxy record described by Moy et al. (2002) displays a millennial-scale oscillation that in the middle Holocene shifts its variance from a 1000-1500-yr period to a 2000-2500-yr period (Moy et al. 2002, their figure 1c). Both frequencies correspond to known solar periodicities, the Eddy and Bray solar cycles. As it has been shown previously (see “Centennial to millennial solar cycles“) the 1000-yr Eddy solar cycle became weaker at the Mid-Holocene Transition regaining strength in the last 2000 years. This 14C-deduced solar behavior corresponds to the ENSO behavior described by Moy et al. (2002).
In 2000 Theodore Landscheidt published an article in the proceedings from a meeting presenting his hypothesis of a solar forcing of El Niño and La Niña. He was not the first to defend such hypothesis, as 10 years earlier Roger Anderson (1990) had published some evidence for a solar cycle modulation of ENSO as a possible source of climatic change. Landscheidt’s (2000) article contains two observations and two predictions. The first observation is that most extreme ENSO events correlate with the ascending or descending phase of the solar cycle. He predicted the following El Niño based on the sun’s orbital angular momentum for 2002.9 (± 0.4). It was a 2-year ahead accurate prediction, as the next El Niño started in 2002.67. The second observation was the alternating preponderance of El Niño and La Niña following the 22-year Hale magnetic solar cycle. The 1954-76 Hale cycle showed Niña preponderance, and was followed by the 1976-96 that presented Niño dominance. While this is based only on two complete Hale cycles for which there is instrumental ENSO data it is interesting to read Landscheidt other prediction:
“If the pattern holds a preponderance of La Niña is to be expected during the Hale cycle that began in 1996.”
The Hale cycle-ENSO association is unclear to me due to insufficient data but it is undeniable that both of Landscheidt predictions were correct. Anderson’s and Landscheidt’s articles were completely ignored by the scientific community and they are rarely cited even by authors studying the same subject.
In 2008 van Loon & Meehl showed that the Pacific Ocean displayed a response to peak solar activity years similar to La Niña event years in the Southern Oscillation, but with a different stratospheric response. Haam & Tung (2012), however, failed to find an association between solar peak and La Niña years and warned that two autocorrelated time series might present a spurious correlation by chance. As I will show the problem is in the assumption that ENSO must display a linear response to solar activity with ENSO extremes at maximal and minimal solar activity. This assumption turns out to be false and the analysis of Haam & Tung (2012) using peak-solar years is misleading.
ENSO is usually described as a 2-7-year oscillation, while the Schwabe solar cycle is an 11 ± 2-year oscillation, so no linear relationship is obvious. White & Liu (2008) defend that most El Niño and La Niña episodes from 1900–2005 are grouped into non-commuting pairs that repeat every ~ 11 years, aligned with rising and falling transition phases of the solar cycle as Landscheidt (2000) described (they don’t cite him). These alignments arise from non-linear phase locking between an 11-year solar forced first harmonic and the 3rd and 5th 3.6 and 2.2-year harmonics in ENSO. These solar-forced 3rd and 5th harmonics explain ~ 52% of inter-annual variance in the Nino-3 temperature index. White & Liu (2008) propose “a new paradigm for ENSO, with El Niño and La Niña driven by the solar-forced quasi-decadal oscillation via non-linear processes in the tropical Pacific delayed action/recharge oscillator.”
Despite the evidence for a solar forcing of ENSO the accepted paradigm from model studies is that ENSO is self-excited or driven by internal variability random noise.
More recently two solar physicists, Leamon & McIntosh (2017), reported on the coincidence of the termination of the solar magnetic activity bands at the solar equator every ~ 11 years since the 1960s with a shift from El Niño to La Niña conditions in the Pacific. Their report prompted me to examine the issue, observing a pattern repetition since 1956 (figure 2). The solar minimum is preceded by Niña conditions, followed by Niño conditions, and afterwards Niña conditions accompany the rapid increase in solar activity.
If we assign 50% probability for seasonal positive or negative ONI (Oceanic Niño Index) values, the probability that the solar minimum will be preceded by Niña conditions, and followed by Niño conditions for six consecutive solar minima by chance is of only 0.024% (1 in 4000). The probability of the entire pattern (Niña-Niño-Niña) repeating six times at a specific time is even lower, indicating that the association between solar activity and ENSO is not due to chance. Solar control of ENSO has led to the prediction of El Niño conditions in 2018-19 by me, and to La Niña conditions in 2020-21 by Leamon & McIntosh (2017). The 2018-19 Niño prediction has been correct.
----------
Of course ENSO is not exclusively under solar control as it is a very complex phenomenon, and thus we shouldn’t expect that the patterns are always reproduced. However it is clear from paleoclimatic data (Moy et al., 2002), solar physics (Leamon & McIntosh 2017), Modeling and reanalysis (van Loon & Meehl 2008), frequency analysis (White & Liu 2008), and the present analysis, that solar activity has a clear strong effect on ENSO, probably being its main forcing. The reported 2-7-year ENSO periodicity appears to be an 11-year periodicity with several occurrences. The present (mid-2019) position in the solar cycle is at the transition between phases III-IV, close to the solar minimum. With some uncertainty due to the irregularity of the 11-yr solar cycle, a La Niña can be projected for phase V, by mid-2020 (Leamon & McIntosh 2017). The failed El Niño projection from February 2017 by ENSO models (figure 6) took place at the transition between phases II and III in figure 5, a time when the solar cycle favors La Niña conditions that finally developed a few months later. This is an instance when ENSO prediction from solar activity would have been superior to models.
Sunday, September 01, 2019
How the Media Help to Destroy Rational Climate Debate
Here is a blog entry from Roy Spencer, Ph.D.
-------------------------------------------
An old mantra of the news business is, “if it bleeds, it leads”. If someone was murdered, it is news. That virtually no one gets murdered is not news. That, by itself, should tell you that the mainstream media cannot be relied upon as an unbiased source of climate change information.
There are lots of self-proclaimed climate experts now. They don’t need a degree in physics or atmospheric science. For credentials, they only need to care and tell others they care. They believe the Earth is being murdered by humans and want the media to spread the word.
Most people do not have the time or educational background to understand the global warming debate, and so defer to the consensus of experts on the subject. The trouble is that no one ever says exactly what the experts agree upon.
When you dig into the details, what the experts agree upon in their official pronouncements is rather unremarkable. The Earth has warmed a little since the 1950s, a date chosen because before that humans had not produced enough CO2 to really matter. Not enough warming for most people to actually feel, but enough for thermometers to pick up the signal buried in the noise of natural weather swings of many tens of degrees and spurious warming from urbanization effects. The UN consensus is that most of that warming is probably due to increasing atmospheric CO2 from fossil fuel use (but we really don’t know for sure).
For now, I tend to agree with this consensus.
And still I am widely considered a climate denier.
Why? Because I am not willing to exaggerate and make claims that cannot be supported by data.
Take researcher Roger Pielke, Jr. as another example. Roger considers himself an environmentalist. He generally agrees with the predictions of the UN Intergovernmental Panel on Climate Change (IPCC) regarding future warming. But as an expert in severe weather damages, he isn’t willing to support the lie that severe weather has gotten worse. Yes, storm damages have increased, but that’s because we keep building more infrastructure to get damaged.
So, he, too is considered a climate denier.
What gets reported by the media about global warming (aka climate change, the climate crisis, and now the climate emergency) is usually greatly exaggerated, half-truths, or just plain nonsense. Just like the economy and economists, it is not difficult to find an expert willing to provide a prediction of gloom and doom. That makes interesting news. But it distorts the public perception of the dangers of climate change. And because it is reported as “science”, it is equated with truth.
In the case of climate change news, the predicted effects are almost universally biased toward Armageddon-like outcomes. Severe weather events that have always occurred (tornadoes, hurricanes, floods, droughts) are now reported with at least some blame placed on your SUV.
The major media outlets have so convinced themselves of the justness, righteousness, and truthfulness of their cause that they have banded together to make sure the climate emergency is not ignored. As reported by The Guardian, “More than 60 news outlets worldwide have signed on to Covering Climate Now, a project to improve coverage of the emergency”.
The exaggerations are not limited to just science. The reporting on engineering related to proposed alternative sources of energy (e.g. wind and solar) is also biased. The reported economics are biased. Unlimited “free” energy is claimed to be all around us, just waiting to be plucked from the unicorn tree.
And for most of America (and the world), the reporting is not making us smarter, but dumber.
Why does it matter? Who cares if the science (or engineering or economics) is exaggerated, if the result is that we stop polluting?
Besides the fact that there is no such thing as a non-polluting energy source, it matters because humanity depends upon abundant, affordable energy to prosper. Just Google life expectancy and per capita energy use. Prosperous societies are healthier and enjoy longer lives. Expensive sources of energy forced upon the masses by governmental fiat kill poor people simply because expensive energy exacerbates poverty, and poverty leads to premature death. As philosopher Alex Epstein writes in his book, The Moral Case for Fossil Fuels, if you believe humans have a right to thrive, then you should be supportive of fossil fuels.
We don’t use wind and solar energy because it is economically competitive. We use it because governments have decided to force taxpayers to pay the extra costs involved and allowed utilities to pass on the higher costs to consumers. Wind and solar use continue to grow, but global energy demand grows even faster. Barring some new energy technology (or a renewed embrace of nuclear power), wind and solar are unlikely to supply more than 10% of global energy demand in the coming decades. And as some European countries have learned, mandated use of solar and wind comes at a high cost to society.
Not only the media, but the public education system is complicit in this era of sloppy science reporting. I suppose most teachers and journalists believe what they are teaching and reporting on. But they still bear some responsibility for making sure what they report is relatively unbiased and factual.
I would much rather have teachers spending more time teaching students how to think and less time teaching them what to think.
Climate scientists are not without blame. They, like everyone else, are biased. Virtually all Earth scientists I know view the Earth as “fragile”. Their biases affect their analysis of uncertain data that can be interpreted in multiple ways. Most are relatively clueless about engineering and economics. I’ve had discussions with climate scientists who tell me, “Well, we need to get away from fossil fuels, anyway”.
And maybe we do, eventually. But exaggerating the threat can do more harm than good. The late Stephen Schneider infamously admitted to biased reporting by scientists. You can read his entire quote and decide for yourself whether scientists like Dr. Schneider let their worldview, politics, etc., color how they present their science to the public. The unauthorized release of the ‘ClimateGate’ emails between IPCC scientists showed how the alarmist narrative was maintained by undermining alternative views and even pressuring the editors of scientific journals. Even The Guardian seemed shocked by the misbehavior.
It’s fine to present the possibility that human-caused global warming could be very damaging, which is indeed theoretically possible. But to claim that large and damaging changes have already occurred due to increasing CO2 in the atmosphere is shoddy journalism. Some reporters get around the problem by saying that the latest hurricane might not be blamed on global warming directly, but it represents what we can expect more of in a warming world. Except that, even the UN IPCC is equivocal on the subject.
Sea level rise stories in the media, as far as I can tell, never mention that sea level has been rising naturally for as long as we have had global tide gauge measurements (since the 1850s). Maybe humans are responsible for a portion of the recent rise, but as is the case for essentially all climate reporting, the role of nature is seldom mentioned, and the size of the problem is almost always exaggerated. That worsening periodic tidal flooding in Miami Beach is about 50% due to sinking of reclaimed swampland is never mentioned.
There are no human fingerprints of global warming. None. Climate change is simply assumed to be mostly human-caused (which is indeed possible), while our knowledge of natural climate change is almost non-existent.
Computerized climate models are programmed based upon the assumption of human causation. The models produce human-caused climate change because they are forced to produce no warming (be in a state of ‘energy balance’) unless CO2 is added to them.
As far as we know, no one has ever been killed by human-caused climate change. Weather-related deaths have fallen dramatically — by over 90% — in the last 100 years.
Whose child has been taught that in school? What journalist has been brave enough to report that good news?
In recent years I’ve had more and more people tell me that their children, grandchildren, or young acquaintances are now thoroughly convinced we are destroying the planet with our carbon dioxide emissions from burning of fossil fuels. They’ve had this message drilled into their brains through news reporting, movies, their teachers and professors, their favorite celebrities, and a handful of outspoken scientists and politicians whose knowledge of the subject is a mile wide but only inches deep.
In contrast, few people are aware of the science papers showing satellite observations that reveal a global greening phenomenon is occurring as a result of more atmospheric CO2.
Again I ask, whose child has been taught this in school? What journalist dares to report any positive benefits of CO2, without which life on Earth would not exist?
No, if it’s climate news, it’s all bad news, all the time.
More Examples of Media Bias
Here are just a few recent (and not-so-recent) examples of media reporting which only make matters worse and degrade the public debate on the subject of climate change. Very often what is reported is actually weather-related events that have always occurred with no good evidence that they have worsened or become more frequent in the last 60+ years that humans could be at least partly blamed.
The Amazon is burning
A few days ago, The Guardian announced Large swathes of the Amazon rainforest are burning. I don’t know how this has suddenly entered the public’s consciousness, but for those of us who keep track of such things, farmland and some rainforest in Amazonia and adjacent lands has been burned by farmers for many decades during this time of year so they can plant crops. This year is not exceptional in this regard, yet someone decided to make an issue of it this year. In fact, it looks like 2019 might be one of the lowest years for biomass burning. Deforestation there has gone down dramatically in the last 20 years.
The rainforest itself does not burn in response to global warming, and in fact warming in the tropics has been so slow that it is unlikely that any tropical resident would perceive it in their lifetime. This is not a climate change issue; it’s a farming and land use issue.
Greenland Is rapidly melting
The Greenland ice sheet gains new snow every year, and gravity causes the sheet to slowly flow to the sea where ice is lost by calving of icebergs. How much ice resides in the sheet at any given time is based upon the balance between gains and losses.
During the summer months of June, July, and August there is more melting of the surface than snow accumulation. The recent (weather-related) episode of a Saharan air mass traveling through western Europe and reaching Greenland led to a few days of exceptional melt. This was widely reported as having grave consequences.
Forbes decided to push the limits of responsible journalism with a story title, Greenland’s Massive Ice Melt Wasn’t Supposed to Happen Until 2070. But the actual data show that after this very brief period (a few days) of strong melt, conditions then returned to normal.

Of course, only the brief period of melt was reported by the media, further feeding the steady diet of biased climate information we have all become accustomed to.
Furthermore, after all of the reports of record warmth at the summit of the ice cap, it was found that the temperature sensor readings were biased too warm, and the temperature never actually went above freezing.
Was this reported with the same fanfare as the original story? Of course not. The damage has been done, and the thousands of alarmist news stories will live on in perpetuity.
This isn’t to say that Greenland isn’t losing more ice than it is gaining, but most of that loss is due to calving of icebergs around the edge of the sheet being fed by ice flowing downhill. Not from blast-furnace heating of the surface. It could be the loss in recent decades is a delayed response to excess snow accumulation tens or hundreds of years ago (I took glaciology as a minor while working on my Ph.D. in meteorology). No one really knows because ice sheet dynamics is complicated with much uncertainty.
My point is that the public only hears about these brief weather events which are almost always used to promote an alarmist narrative.
July 2019 was the hottest month on record
The yearly, area-averaged surface temperature of the Earth is about 60 deg. F. It has been slowly and irregularly rising in recent decades at a rate of about 0.3 or 0.4 deg. F per decade.
So, let’s say the average temperature reaches 60.4 deg. F rather than a more normal 60 deg. F. Is “hottest” really the best adjective to use to inform the public about what is going on?
Here’s a geographic plot of the July 2019 departures from normal from NOAA’s Climate Forecast
Some areas were above normal, some below, yet the headlines of “hottest month ever” would make you think the whole Earth had become an oven of unbearable heat.
Of course, the temperature changes involved in new record warm months is so small it is usually less than the uncertainty level of the measurements. And, different global datasets give different results. Monitoring global warming is like searching for a climate needle in a haystack of weather variability.
Bait and Switch: Models replacing observations
There is an increasing trend toward passing off climate model projections as actual observations in news reports. This came up just a few days ago when I was alerted to a news story that claimed Tuscaloosa, Alabama is experiencing twice as many 100+ deg. F days as it used to. To his credit, the reporter corrected the story when it was pointed out to him that no such thing has happened, and it was a climate model projection that (erroneously) made such a “prediction”.
Another example happened last year with a news report that the 100th Meridian climate boundary in the U.S. was moving east, with gradual drying starting to invade the U.S. Midwest agricultural belt. But, once again, the truth is that no such thing has happened. It was a climate model projection, being passed off as reality. Having worked with grain-growing interests for nearly 10 years, I addressed this bit of fake climate news with actual precipitation measurements here.
Al Gore and Bill Nye’s global warming in a jar experiment
This is one of my favorites.
Greta Thunberg’s sailboat trip
The new spokesperson for the world’s youth regarding concerns over global warming is 16-year-old Swede Greta Thunberg. Greta is travelling across the Atlantic on what CNN describes as a “zero-emissions yacht” to attend the UN Climate Action Summit on September 23 in New York City.
To begin with, there is no such thing as a zero-emissions yacht. A huge amount of energy was required to manufacture the yacht, and it transports so few people so few miles over its lifetime the yacht is a wonderful example of the energy waste typical of the lifestyles of the wealthy elite. Four (!) people will need to fly from Europe to the U.S. to support the return of the yacht to Europe after Greta is delivered there.
The trip is nothing more than a publicity stunt, and it leads to further disinformation regarding global energy use. In fact, it works much better as satire. Imagine if everyone who traveled across the ocean used yachts rather than jet airplanes. More energy would be required, not less, due to the manufacture of tens of thousands of extra yachts which inefficiently carry few passengers on relatively few, very slow trips. In contrast, the average jet aircraft will travel 50 million miles in its lifetime. Most people don’t realize that travel by jet is now more fuel efficient than travel by car.
The Greta boat trip story is in so many ways the absolute worst way to raise awareness of climate issues, unless you know knothing of science, engineering, or economics. It’s like someone who is against eating meat consuming three McDonalds cheeseburgers to show how we should change our diets. It makes zero sense.
I could give many more examples of the media helping to destroy the public’s ability to have a rational discussion about climate change, how much is caused by humans, and what can or should be done about it.
Instead, the media chooses to publish only the most headline-grabbing stories, and the climate change issue is then cast as two extremes: either you believe the “real scientists” who all agree we are destroying the planet, or you are a knuckle-dragging 8th-grade educated climate denier with guns and racist tendencies.
-------------------------------------------
An old mantra of the news business is, “if it bleeds, it leads”. If someone was murdered, it is news. That virtually no one gets murdered is not news. That, by itself, should tell you that the mainstream media cannot be relied upon as an unbiased source of climate change information.
There are lots of self-proclaimed climate experts now. They don’t need a degree in physics or atmospheric science. For credentials, they only need to care and tell others they care. They believe the Earth is being murdered by humans and want the media to spread the word.
Most people do not have the time or educational background to understand the global warming debate, and so defer to the consensus of experts on the subject. The trouble is that no one ever says exactly what the experts agree upon.
When you dig into the details, what the experts agree upon in their official pronouncements is rather unremarkable. The Earth has warmed a little since the 1950s, a date chosen because before that humans had not produced enough CO2 to really matter. Not enough warming for most people to actually feel, but enough for thermometers to pick up the signal buried in the noise of natural weather swings of many tens of degrees and spurious warming from urbanization effects. The UN consensus is that most of that warming is probably due to increasing atmospheric CO2 from fossil fuel use (but we really don’t know for sure).
For now, I tend to agree with this consensus.
And still I am widely considered a climate denier.
Why? Because I am not willing to exaggerate and make claims that cannot be supported by data.
Take researcher Roger Pielke, Jr. as another example. Roger considers himself an environmentalist. He generally agrees with the predictions of the UN Intergovernmental Panel on Climate Change (IPCC) regarding future warming. But as an expert in severe weather damages, he isn’t willing to support the lie that severe weather has gotten worse. Yes, storm damages have increased, but that’s because we keep building more infrastructure to get damaged.
So, he, too is considered a climate denier.
What gets reported by the media about global warming (aka climate change, the climate crisis, and now the climate emergency) is usually greatly exaggerated, half-truths, or just plain nonsense. Just like the economy and economists, it is not difficult to find an expert willing to provide a prediction of gloom and doom. That makes interesting news. But it distorts the public perception of the dangers of climate change. And because it is reported as “science”, it is equated with truth.
In the case of climate change news, the predicted effects are almost universally biased toward Armageddon-like outcomes. Severe weather events that have always occurred (tornadoes, hurricanes, floods, droughts) are now reported with at least some blame placed on your SUV.
The major media outlets have so convinced themselves of the justness, righteousness, and truthfulness of their cause that they have banded together to make sure the climate emergency is not ignored. As reported by The Guardian, “More than 60 news outlets worldwide have signed on to Covering Climate Now, a project to improve coverage of the emergency”.
The exaggerations are not limited to just science. The reporting on engineering related to proposed alternative sources of energy (e.g. wind and solar) is also biased. The reported economics are biased. Unlimited “free” energy is claimed to be all around us, just waiting to be plucked from the unicorn tree.
And for most of America (and the world), the reporting is not making us smarter, but dumber.
Why does it matter? Who cares if the science (or engineering or economics) is exaggerated, if the result is that we stop polluting?
Besides the fact that there is no such thing as a non-polluting energy source, it matters because humanity depends upon abundant, affordable energy to prosper. Just Google life expectancy and per capita energy use. Prosperous societies are healthier and enjoy longer lives. Expensive sources of energy forced upon the masses by governmental fiat kill poor people simply because expensive energy exacerbates poverty, and poverty leads to premature death. As philosopher Alex Epstein writes in his book, The Moral Case for Fossil Fuels, if you believe humans have a right to thrive, then you should be supportive of fossil fuels.
We don’t use wind and solar energy because it is economically competitive. We use it because governments have decided to force taxpayers to pay the extra costs involved and allowed utilities to pass on the higher costs to consumers. Wind and solar use continue to grow, but global energy demand grows even faster. Barring some new energy technology (or a renewed embrace of nuclear power), wind and solar are unlikely to supply more than 10% of global energy demand in the coming decades. And as some European countries have learned, mandated use of solar and wind comes at a high cost to society.
Not only the media, but the public education system is complicit in this era of sloppy science reporting. I suppose most teachers and journalists believe what they are teaching and reporting on. But they still bear some responsibility for making sure what they report is relatively unbiased and factual.
I would much rather have teachers spending more time teaching students how to think and less time teaching them what to think.
Climate scientists are not without blame. They, like everyone else, are biased. Virtually all Earth scientists I know view the Earth as “fragile”. Their biases affect their analysis of uncertain data that can be interpreted in multiple ways. Most are relatively clueless about engineering and economics. I’ve had discussions with climate scientists who tell me, “Well, we need to get away from fossil fuels, anyway”.
And maybe we do, eventually. But exaggerating the threat can do more harm than good. The late Stephen Schneider infamously admitted to biased reporting by scientists. You can read his entire quote and decide for yourself whether scientists like Dr. Schneider let their worldview, politics, etc., color how they present their science to the public. The unauthorized release of the ‘ClimateGate’ emails between IPCC scientists showed how the alarmist narrative was maintained by undermining alternative views and even pressuring the editors of scientific journals. Even The Guardian seemed shocked by the misbehavior.
It’s fine to present the possibility that human-caused global warming could be very damaging, which is indeed theoretically possible. But to claim that large and damaging changes have already occurred due to increasing CO2 in the atmosphere is shoddy journalism. Some reporters get around the problem by saying that the latest hurricane might not be blamed on global warming directly, but it represents what we can expect more of in a warming world. Except that, even the UN IPCC is equivocal on the subject.
Sea level rise stories in the media, as far as I can tell, never mention that sea level has been rising naturally for as long as we have had global tide gauge measurements (since the 1850s). Maybe humans are responsible for a portion of the recent rise, but as is the case for essentially all climate reporting, the role of nature is seldom mentioned, and the size of the problem is almost always exaggerated. That worsening periodic tidal flooding in Miami Beach is about 50% due to sinking of reclaimed swampland is never mentioned.
There are no human fingerprints of global warming. None. Climate change is simply assumed to be mostly human-caused (which is indeed possible), while our knowledge of natural climate change is almost non-existent.
Computerized climate models are programmed based upon the assumption of human causation. The models produce human-caused climate change because they are forced to produce no warming (be in a state of ‘energy balance’) unless CO2 is added to them.
As far as we know, no one has ever been killed by human-caused climate change. Weather-related deaths have fallen dramatically — by over 90% — in the last 100 years.
Whose child has been taught that in school? What journalist has been brave enough to report that good news?
In recent years I’ve had more and more people tell me that their children, grandchildren, or young acquaintances are now thoroughly convinced we are destroying the planet with our carbon dioxide emissions from burning of fossil fuels. They’ve had this message drilled into their brains through news reporting, movies, their teachers and professors, their favorite celebrities, and a handful of outspoken scientists and politicians whose knowledge of the subject is a mile wide but only inches deep.
In contrast, few people are aware of the science papers showing satellite observations that reveal a global greening phenomenon is occurring as a result of more atmospheric CO2.
Again I ask, whose child has been taught this in school? What journalist dares to report any positive benefits of CO2, without which life on Earth would not exist?
No, if it’s climate news, it’s all bad news, all the time.
More Examples of Media Bias
Here are just a few recent (and not-so-recent) examples of media reporting which only make matters worse and degrade the public debate on the subject of climate change. Very often what is reported is actually weather-related events that have always occurred with no good evidence that they have worsened or become more frequent in the last 60+ years that humans could be at least partly blamed.
The Amazon is burning
A few days ago, The Guardian announced Large swathes of the Amazon rainforest are burning. I don’t know how this has suddenly entered the public’s consciousness, but for those of us who keep track of such things, farmland and some rainforest in Amazonia and adjacent lands has been burned by farmers for many decades during this time of year so they can plant crops. This year is not exceptional in this regard, yet someone decided to make an issue of it this year. In fact, it looks like 2019 might be one of the lowest years for biomass burning. Deforestation there has gone down dramatically in the last 20 years.
The rainforest itself does not burn in response to global warming, and in fact warming in the tropics has been so slow that it is unlikely that any tropical resident would perceive it in their lifetime. This is not a climate change issue; it’s a farming and land use issue.
Greenland Is rapidly melting
The Greenland ice sheet gains new snow every year, and gravity causes the sheet to slowly flow to the sea where ice is lost by calving of icebergs. How much ice resides in the sheet at any given time is based upon the balance between gains and losses.
During the summer months of June, July, and August there is more melting of the surface than snow accumulation. The recent (weather-related) episode of a Saharan air mass traveling through western Europe and reaching Greenland led to a few days of exceptional melt. This was widely reported as having grave consequences.
Forbes decided to push the limits of responsible journalism with a story title, Greenland’s Massive Ice Melt Wasn’t Supposed to Happen Until 2070. But the actual data show that after this very brief period (a few days) of strong melt, conditions then returned to normal.

The widely reported Greenland surface melt event around 1 August 2019 (green oval) was then followed by a recovery to normal in the following weeks (purple oval), which was not reported by the media.
Of course, only the brief period of melt was reported by the media, further feeding the steady diet of biased climate information we have all become accustomed to.
Furthermore, after all of the reports of record warmth at the summit of the ice cap, it was found that the temperature sensor readings were biased too warm, and the temperature never actually went above freezing.
Was this reported with the same fanfare as the original story? Of course not. The damage has been done, and the thousands of alarmist news stories will live on in perpetuity.
This isn’t to say that Greenland isn’t losing more ice than it is gaining, but most of that loss is due to calving of icebergs around the edge of the sheet being fed by ice flowing downhill. Not from blast-furnace heating of the surface. It could be the loss in recent decades is a delayed response to excess snow accumulation tens or hundreds of years ago (I took glaciology as a minor while working on my Ph.D. in meteorology). No one really knows because ice sheet dynamics is complicated with much uncertainty.
My point is that the public only hears about these brief weather events which are almost always used to promote an alarmist narrative.
July 2019 was the hottest month on record
The yearly, area-averaged surface temperature of the Earth is about 60 deg. F. It has been slowly and irregularly rising in recent decades at a rate of about 0.3 or 0.4 deg. F per decade.
So, let’s say the average temperature reaches 60.4 deg. F rather than a more normal 60 deg. F. Is “hottest” really the best adjective to use to inform the public about what is going on?
Here’s a geographic plot of the July 2019 departures from normal from NOAA’s Climate Forecast
System model.
 July 2019 surface temperature departures from normal. The global average is only 0.3 deg. C (0.5 deg. F) above the 1981-2010 average, and many areas were below normal in temperature. (Graphic courtesy WeatherBell.com).

Some areas were above normal, some below, yet the headlines of “hottest month ever” would make you think the whole Earth had become an oven of unbearable heat.
Of course, the temperature changes involved in new record warm months is so small it is usually less than the uncertainty level of the measurements. And, different global datasets give different results. Monitoring global warming is like searching for a climate needle in a haystack of weather variability.
Bait and Switch: Models replacing observations
There is an increasing trend toward passing off climate model projections as actual observations in news reports. This came up just a few days ago when I was alerted to a news story that claimed Tuscaloosa, Alabama is experiencing twice as many 100+ deg. F days as it used to. To his credit, the reporter corrected the story when it was pointed out to him that no such thing has happened, and it was a climate model projection that (erroneously) made such a “prediction”.
Another example happened last year with a news report that the 100th Meridian climate boundary in the U.S. was moving east, with gradual drying starting to invade the U.S. Midwest agricultural belt. But, once again, the truth is that no such thing has happened. It was a climate model projection, being passed off as reality. Having worked with grain-growing interests for nearly 10 years, I addressed this bit of fake climate news with actual precipitation measurements here.
Al Gore and Bill Nye’s global warming in a jar experiment
This is one of my favorites.
As part of Al Gore’s Climate Reality Project, Bill Nye produced a Climate 101 video of an experiment where two glass jars with thermometers in them were illuminated by lamps. One jar had air in it, the other had pure CO2. The video allegedly shows the jar with CO2 in it experiencing a larger temperature rise than the jar with just air in it.
Of course, this was meant to demonstrate how easy it is to show more CO2 causes warming. I’m sure it has inspired many school science experiments. The video has had over 500,000 views.
The problem is that this experiment cannot show such an effect. Any expert in atmospheric radiative transfer can tell you this. The jars are totally opaque to infrared radiation anyway, the amount of CO2 involved is far too small, the thermometers were cheap and inaccurate, the lamps cannot be exactly identical, the jars are not identical, and the “cold” of outer space was not included the experiment. TV meteorologist Anthony Watts demonstrated that Bill Nye had to fake the results through post-production video editing.
The warming effect of increasing atmospheric CO2 is surprisingly difficult to demonstrate. The demonstration is largely a theoretical exercise involving radiative absorption calculations and a radiative transfer model. I believe the effect exists; I’m just saying that there is no easy way to demonstrate it.
The trouble is that this fraudulent video still exists, and many thousands of people are being misled into believing that the experiment is evidence of how obvious it is to
Greta Thunberg’s sailboat trip
The new spokesperson for the world’s youth regarding concerns over global warming is 16-year-old Swede Greta Thunberg. Greta is travelling across the Atlantic on what CNN describes as a “zero-emissions yacht” to attend the UN Climate Action Summit on September 23 in New York City.
To begin with, there is no such thing as a zero-emissions yacht. A huge amount of energy was required to manufacture the yacht, and it transports so few people so few miles over its lifetime the yacht is a wonderful example of the energy waste typical of the lifestyles of the wealthy elite. Four (!) people will need to fly from Europe to the U.S. to support the return of the yacht to Europe after Greta is delivered there.
The trip is nothing more than a publicity stunt, and it leads to further disinformation regarding global energy use. In fact, it works much better as satire. Imagine if everyone who traveled across the ocean used yachts rather than jet airplanes. More energy would be required, not less, due to the manufacture of tens of thousands of extra yachts which inefficiently carry few passengers on relatively few, very slow trips. In contrast, the average jet aircraft will travel 50 million miles in its lifetime. Most people don’t realize that travel by jet is now more fuel efficient than travel by car.
The Greta boat trip story is in so many ways the absolute worst way to raise awareness of climate issues, unless you know knothing of science, engineering, or economics. It’s like someone who is against eating meat consuming three McDonalds cheeseburgers to show how we should change our diets. It makes zero sense.
I could give many more examples of the media helping to destroy the public’s ability to have a rational discussion about climate change, how much is caused by humans, and what can or should be done about it.
Instead, the media chooses to publish only the most headline-grabbing stories, and the climate change issue is then cast as two extremes: either you believe the “real scientists” who all agree we are destroying the planet, or you are a knuckle-dragging 8th-grade educated climate denier with guns and racist tendencies.
Subscribe to:
Posts (Atom)